. 2021 Oct 15;10:e71013. doi: 10.7554/eLife.71013

Figure 4. ssl2 alleles shift transcription start site (TSS) distribution genome-wide.

(A) Schematic indicating TSS distribution within a promoter window defined by median of the wild-type (WT) TSS distribution. (B) Heatmaps of TSS normalized read differences between WT and ssl2 mutants within defined promoter windows. Promoter classes defined by enrichment or depletion of Taf1 were rank-ordered according to total reads in WT. The promoter-normalized read differences between mutant and WT are shown by a color scheme ranging from cyan (negative)-orange (positive). (C) Schematic illustrating median TSS upstream or downstream shift in a mutant relative to WT. (D) Heatmap and hierarchical clustering of median TSS shifts for ssl2 or rpb1 mutants for Taf1-enriched or -depleted promoter classes (promoters as in (B)). The shift of median TSS is indicated by cyan (upstream) or orange (downstream). (E) TSS shifts in ssl2 mutants are less strong than in Pol II mutants. Median TSS shifts across promoters, regardless of promoter class are statistically distinguished from zero at p < 0.0001 for all mutants (Wilcoxon signed rank test).

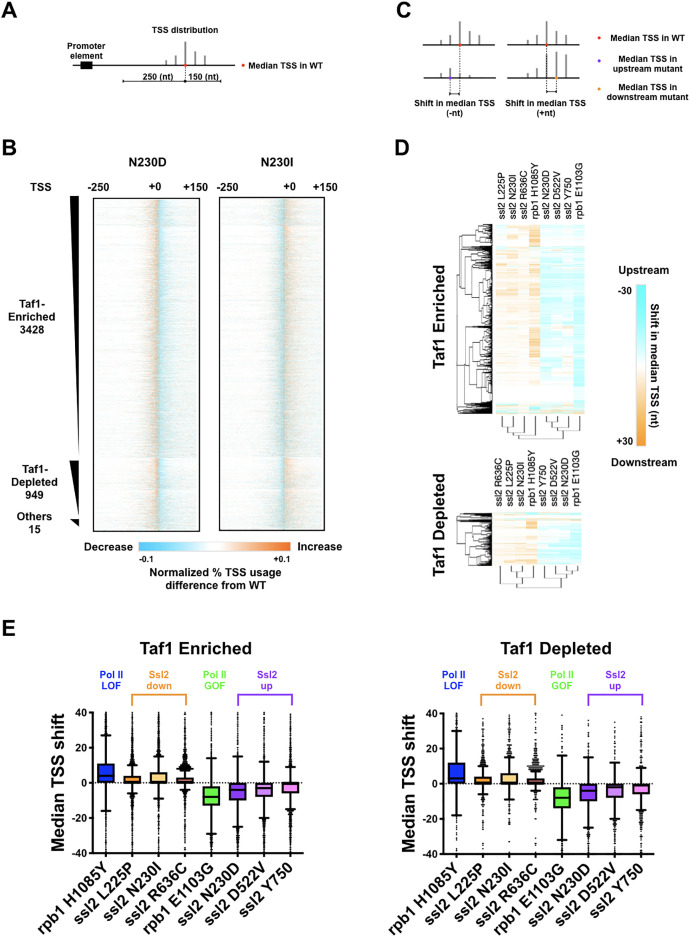
Figure 4—source data 1. Figure 4B ssl2 N230D heatmap data.
Figure 4—source data 2. Figure 4B ssl2 N230I heatmap data.
Figure 4—source data 3. Figure 4DE Taf1-enriched heatmap and graph data.
Figure 4—source data 4. Figure 4DE Taf1-depleted heatmap and graph data.

Figure 4.

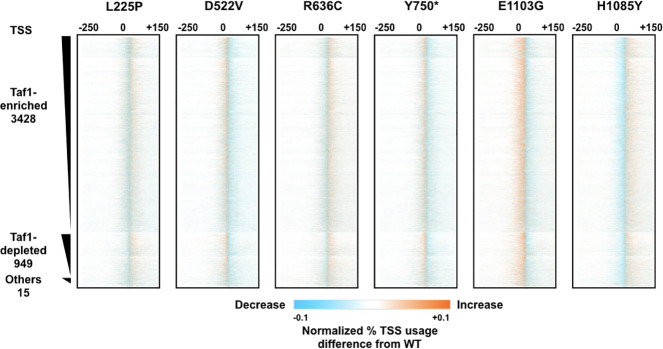
Figure 4—figure supplement 1. Analysis of transcription start site (TSS) shifts in ssl2 and polymerase II (Pol II) mutants.

Figure 4—figure supplement 1.

Difference heatmaps of TSS distributions between wild-type (WT) and other ssl2 mutants as described in Figure 4B. The number of points in the figure is higher than the resolution so some averaging will be present. Note that the color scale has been set with sensitive thresholds to have effects be more visually obvious.
Figure 4—figure supplement 1—source data 1. Figure 4—figure supplement 1 rpb1 E1103G heatmap data.
Figure 4—figure supplement 1—source data 2. Figure 4—figure supplement 1 rpb1 H1085Y heatmap data.
Figure 4—figure supplement 1—source data 3. Figure 4—figure supplement 1 ssl2 L225P heatmap data.
Figure 4—figure supplement 1—source data 4. Figure 4—figure supplement 1 ssl2 D522V heatmap data.
Figure 4—figure supplement 1—source data 5. Figure 4—figure supplement 1 ssl2 R636C heatmap data.
Figure 4—figure supplement 1—source data 6. Figure 4—figure supplement 1 ssl2 Y750* heatmap data.
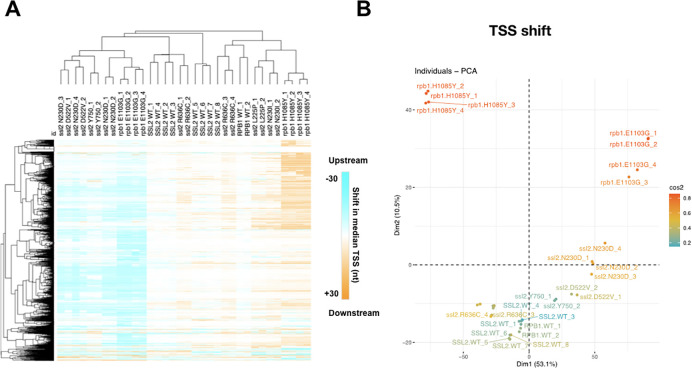
Figure 4—figure supplement 2. Analysis of transcription start site (TSS) shifts in ssl2 and polymerase II (Pol II) mutants.

Figure 4—figure supplement 2.

(A) Heatmap and hierarchical clustering of median TSS shifts for ssl2 or rpb1 mutants in individual replicates. As described in Figure 4D except performed for individual replicate TSS sequencing (TSS-seq) libraries. SSL2WT_2,3,4 are technical replicates as are SSL2WT_5,6,7. All other libraries represent biological replicates. (B) Principal component analysis (PCA) for median TSS shift of ssl2 and Pol II mutants in individual replicate TSS-seq libraries. TSS-seq libraries are separated into five major classes (ssl2 upstream and downstream mutants, WT, Pol II upstream and downstream mutants) by the first dimension consistent with direction of shift, and the second dimension consistent with the different genes.
Figure 4—figure supplement 2—source data 1. Figure 4—figure supplement 2A Heatmap data.