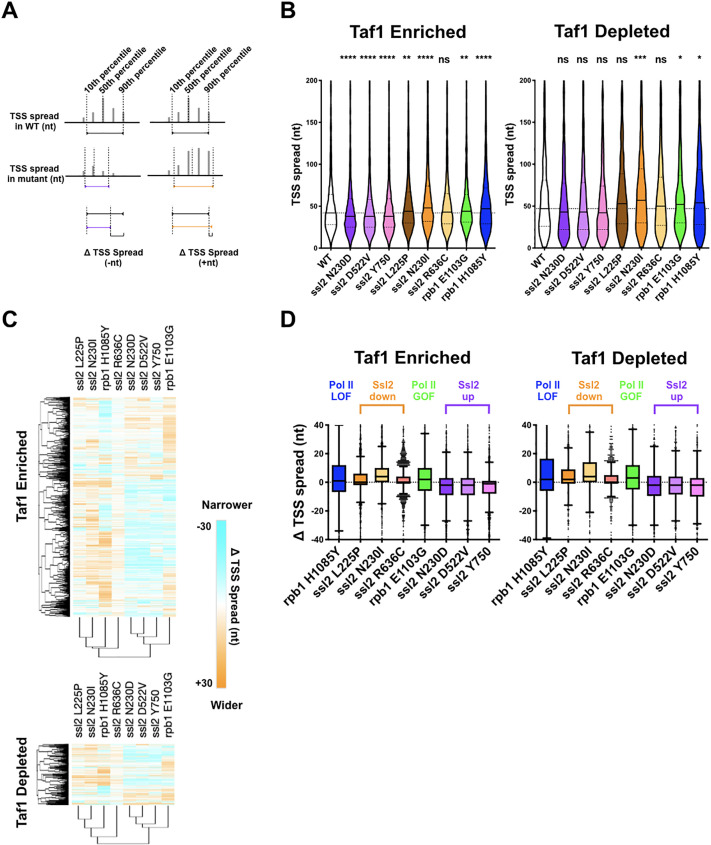
Figure 5. Distinct alterations to transcription start site (TSS) distribution in ssl2 mutants.
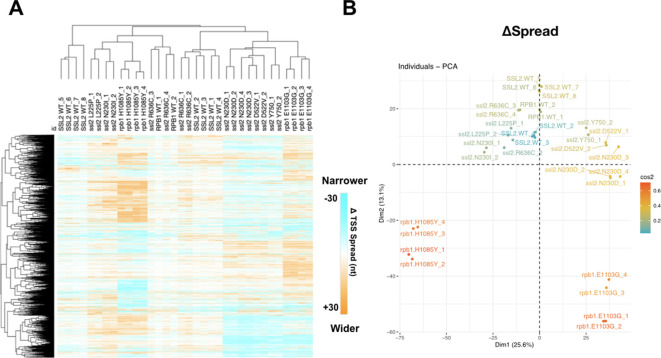
(A) Schematic illustrating TSS ‘spread’ reflecting the distance encompassing 80% of TSSs in a promoter window and the measurement of mutant changes in TSS spread. (B) TSS spreads in ssl2 and Pol II mutants at Taf1-enriched or -depleted promoters. All mutants show a statistical difference in medians from wild type (WT) at p < 0.05 (Kruskal-Wallis test with Dunn’s multiple comparisons test). Asterisks indicate differences in means from WT (*p < 0.05, **p < 0.01, ***p < 0.005, ****p < 0.001). (C) Heatmap showing TSS spread changes for ssl2 or rpb1 mutants by promoter class (hierarchical clustering by mutant on the x-axis and promoter on the y-axis). (D) ssl2 upstream and downstream shifting mutants narrow and widen TSS distributions at promoters as measured in (A). The median TSS spread changes of all the ssl2 and Pol II mutants are statistically distinguished from zero at p < 0.0001 (Wilcoxon signed rank test).


