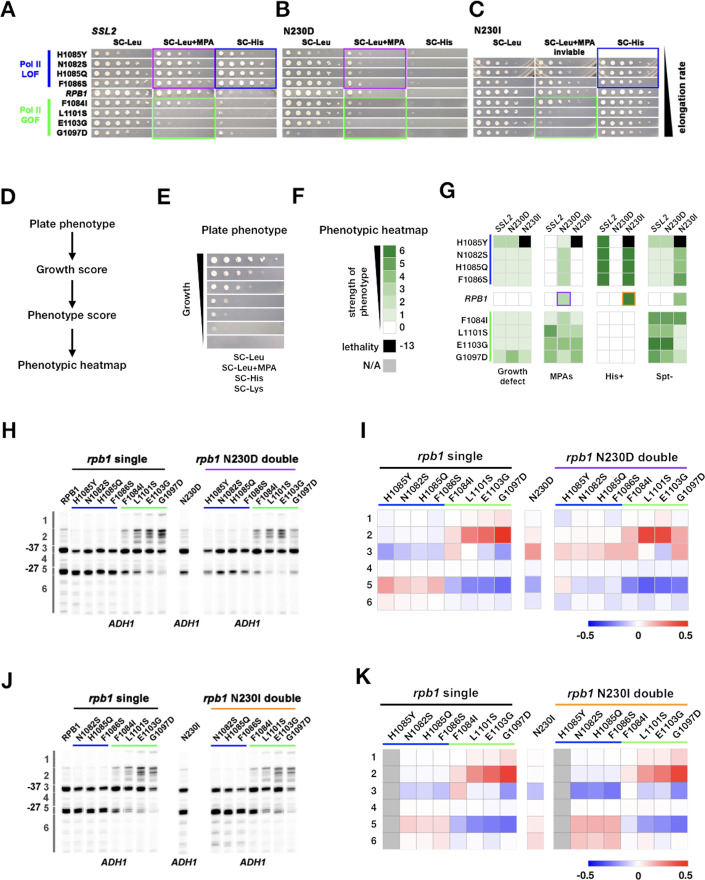
Figure 6. Genetic interactions between ssl2 and polymerase II (Pol II) initiation alleles suggest distinct functions of each in initiation by scanning.
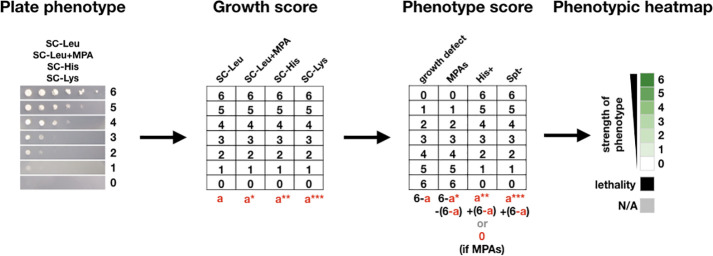
(A) Growth phenotypes of rpb1, ssl2 N230D, ssl2 N230I single or double mutants. rpb1 mutants represent known catalytically hyperactive alleles or genetically similar (G1097D, E1103G, L1101S, F1084I) and four with reduced catalytic activity (F1086S, H1085Q, N1082S, H1085Y). Strains are arranged according to measured Pol II elongation rate in vitro (slowest at top). (B) ssl2 mycophenolic acid (MPA)-sensitive alleles are epistatic to Pol II LOF alleles’ His+ phenotypes (double mutants retain MPAS of ssl2 single mutant while His+ phenotypes of rpb1 mutants are suppressed). Conversely, Pol II transcription start site (TSS) upstream shifting alleles appear epistatic/non-additive with ssl2 MPAS alleles and do not show synthetic growth phenotypes. (C) Pol II upstream TSS shifting alleles appear epistatic to ssl2 N230I phenotypes (MPAS retained and His+ suppressed in double mutants). There are only minor synthetic defects between ssl2 N230I and Pol II downstream TSS shifting mutants suggesting lack of synergistic defect and either mild additivity or epistasis. (Double mutant of N230I and H108Y is nearly dead and was not tested here or in E.) (D,E) Schematic (D) indicating how qualitative growth data of mutants encoded (E) for visualization in heatmaps. (F) Phenotyping heatmap legend. (G) Qualitative heatmaps for ssl2 and rpb1 genetic interactions. Growth phenotypes are detected using reporters described in Figure 1. (H) Primer extension of ssl2 N230D and rpb1 mutants at ADH1. ssl2 N230D appears to truncate distribution of TSSs on downstream side and is epistatic to downstream shifting rpb1 alleles (blue bar) while upstream shifting rpb1 alleles (green bar) are non-additive or epistatic to ssl2 N230D. Numbered regions indicate TSS positions that were binned for quantification in (I). Representative primer extension of ≥3 independent biological replicates is shown. (I) Quantification of (H) with heatmap showing relative differences in TSS distribution binned by position (bins are numbered and shown in H). Mean changes of ≥3 independent biological replicates are shown in the heatmap. (J) Primer extension of ssl2 N230I and rpb1 mutants at ADH1. ssl2 N230I appears to enhance usage of downstream TSSs and is additive with downstream shifting rpb1 alleles (blue bar) while upstream shifting rpb1 alleles (green bar) are epistatic to ssl2 N230I. Numbered regions indicate TSS positions that are binned for quantification in (K). Representative primer extension of ≥3 independent biological replicates is shown. (K) Quantification of (J) with heatmap showing relative differences in TSS distribution binned by position (bins are numbered and shown in (J)). Mean changes of ≥3 independent biological replicates are shown in the heatmap.


