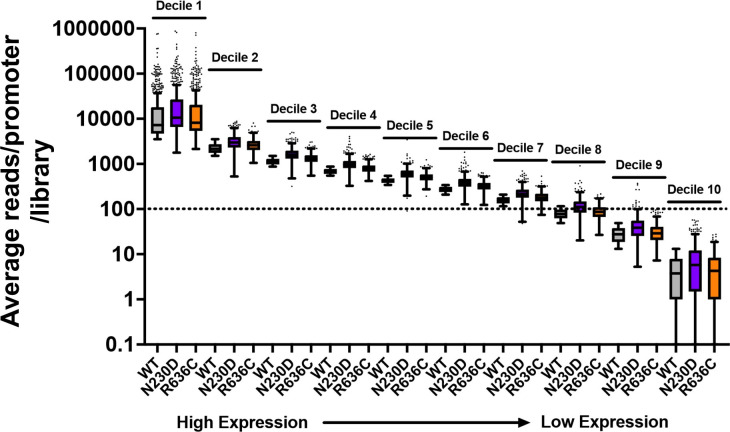
Author response image 1. Example of average reads per promoter per library for WT and two representative ssl2 alleles.
The dotted line indicates that just over 70% of promoters are included in our “Average of 100 reads per WT library” cutoff. Mutant libraries are not undersampled by this cutoff as coverage was similar across libraries and there were not extensive differences in read fractions/promoter (mRNA 5’ end levels). Box plots are Tukey plots.

