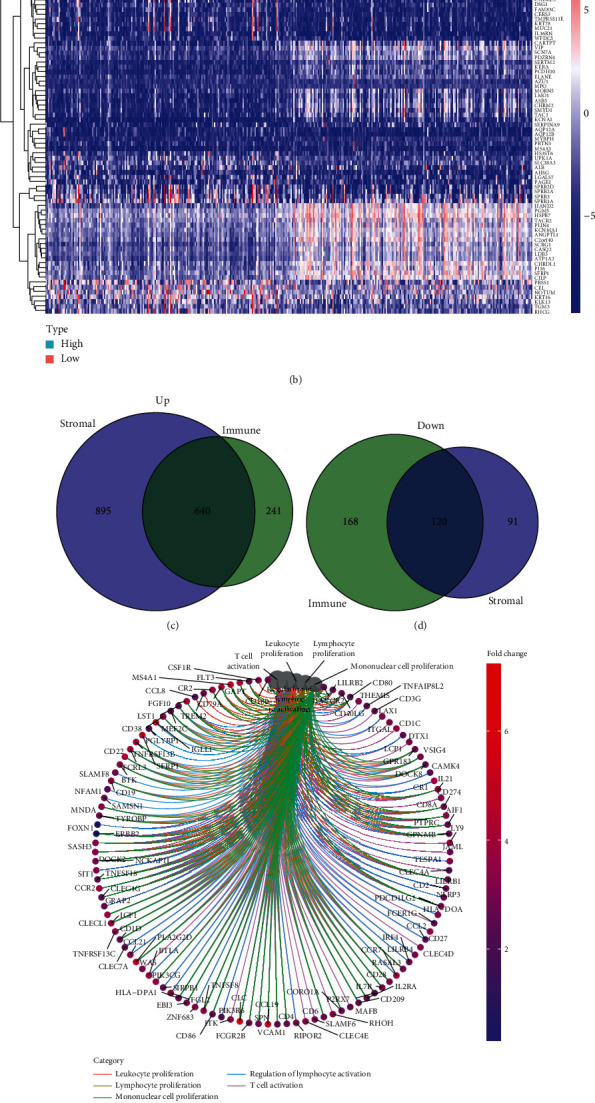
Figure 3.

The expression pattern of DEGs and their enrichment analysis of GO and KEGG. (a) Heatmap for dysregulated genes in ImmuneScore. (b) Heatmap for dysregulated genes in StromalScore. (c, d) Venn plots of common dysregulated genes shared by ImmuneScore and StromalScore. (e, f) GO and KEGG enrichment analyses for 640 DEGs.
