Figure 7.

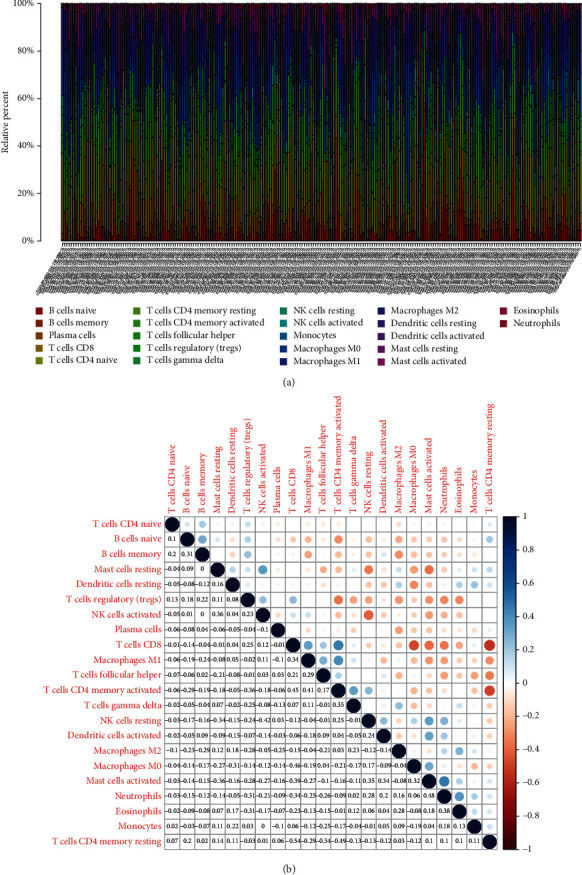
TIC profiles in cancer specimens and correlation assays. (a) Bar plot showing the proportion of 21 kinds of TICs in GC cases. (b) Heatmap of the correlations between 21 kinds of TICs and numeric.

TIC profiles in cancer specimens and correlation assays. (a) Bar plot showing the proportion of 21 kinds of TICs in GC cases. (b) Heatmap of the correlations between 21 kinds of TICs and numeric.