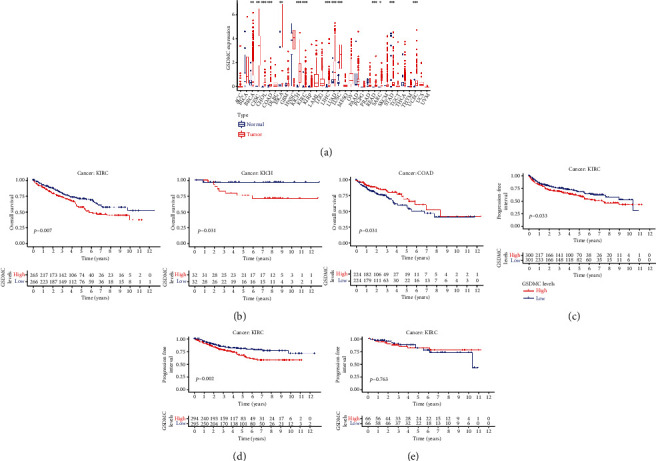
Figure 1.

The correlation between GSDMC expression and prognosis. (a) Pan-cancer analysis of GSDMC expression from TCGA database. (b) The Kaplan-Meier survival curve for overall survival. (c) The Kaplan-Meier survival curve for PFS. (d) The Kaplan-Meier survival curve for DSS. (e) The Kaplan-Meier survival curve for DFS.
