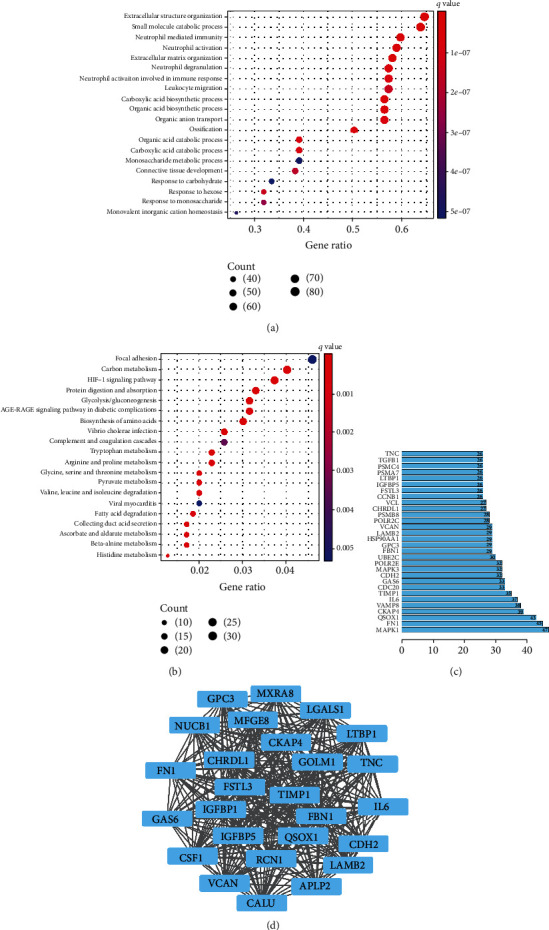
Figure 4.

Functional enrichment of GSDMC coexpressed genes. (a) The top 20 GO functional enrichment analysis of GSDMC coexpressed genes. (b) The top 20 KEGG pathway enrichment analysis of GSDMC coexpressed genes. (c) The top 30 nodes in the number of edges of the protein-protein interaction network node from string database. (d) The core subnetwork of the protein-protein interaction network.
