Figure 7.

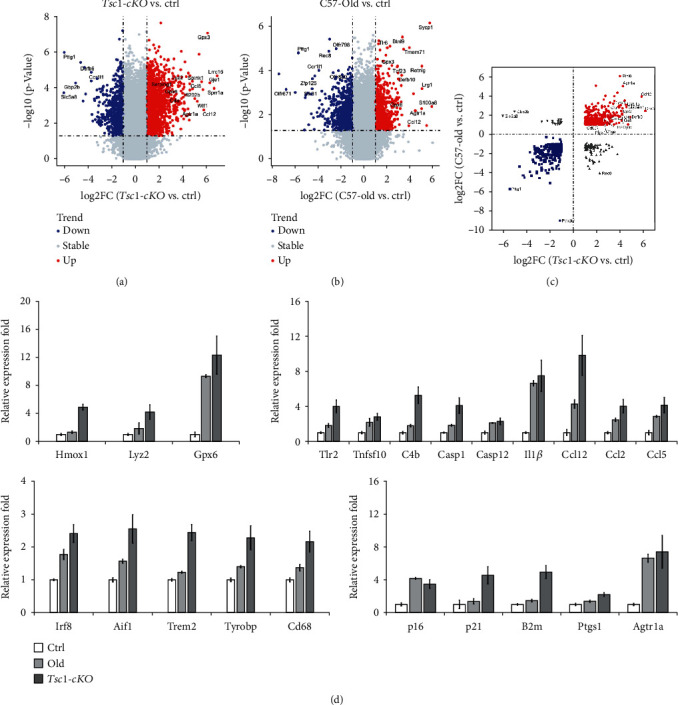
Gene expression profiles of Tsc1-cKO and 24-month-old C57BL/6 mouse retina. (a–c) Volcano plot showed the fold change of genes (log2 scale) and significance (log10 scale) between Tsc1-cKO and age-matched control mouse retina (a) and between 24-month-old C57BL/6 (old) and control (b). The vertical dotted lines indicated the threshold of fold change (log2 > 1). The horizontal dotted line indicated the threshold of the statistical significance (p < 0.05). The DEG for old vs. control and cKO vs. control were plotted against one another in (c). (d) Validation of microarray results with real-time PCR analysis. Fold change was relative to control and calculated as means ± SE. Each PCR was performed using two different samples and in duplicates each time, and the fold change was averaged.
