
Figure 8.
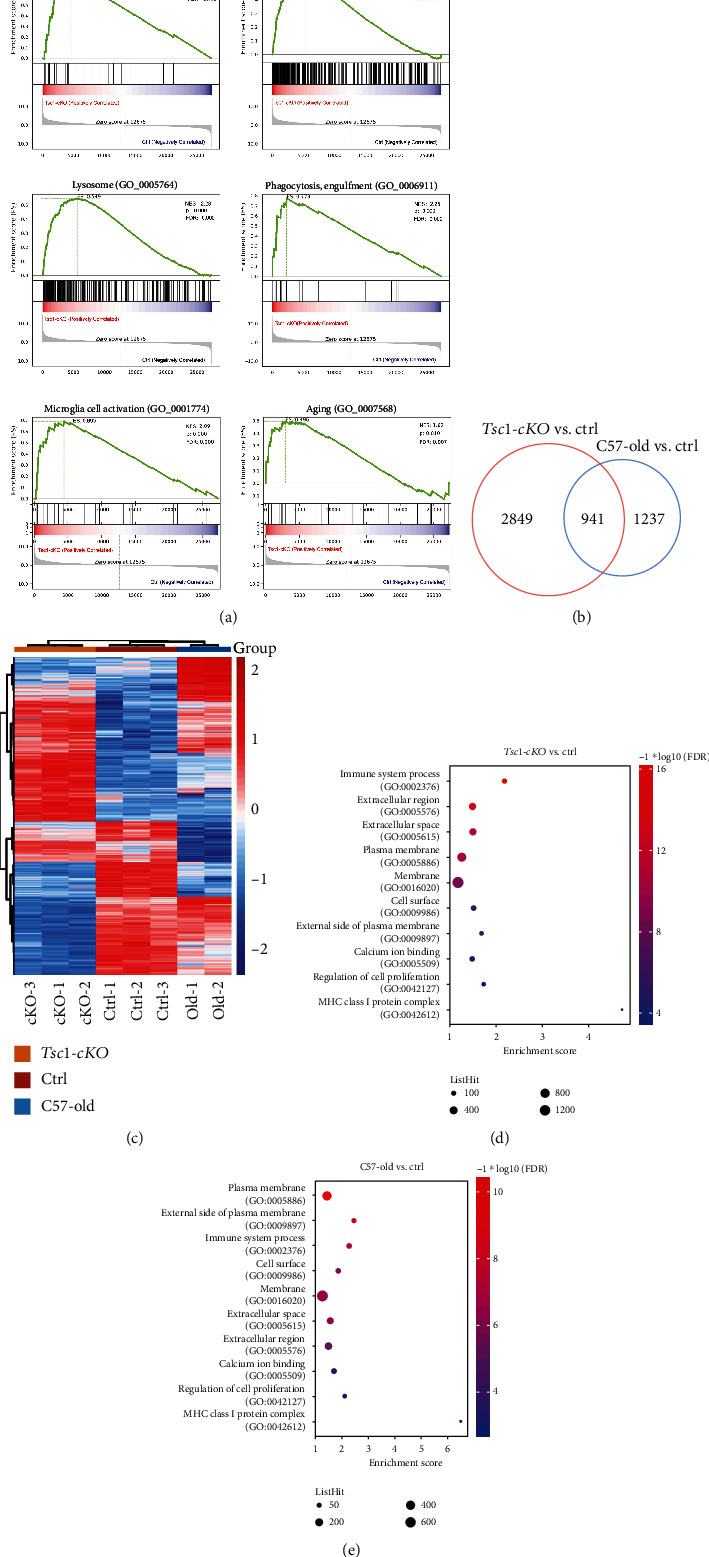
The 5-month-old Tsc1-cKO retina showed gene expression profile characteristic of old-aged retina. (a) Gene set enrichment analysis (GSEA) of DEGs between Tsc1-cKO mice and control mice. Diagrams represented selected gene sets enriched in Tsc1-cKO retina. (b) The Venn diagram of overlap in DEGs between Tsc1-cKO mice and control and old-aged C57BL/6 and control. (c) Hierarchical clustering analysis of all DEGs from Tsc1-cKO mice and control and old-aged C57BL/6 and control. (d) Gene Ontology (GO) analysis showing enrichment of the ten common GO terms in Tsc1-cKO (top) and 24-month-old (bottom).