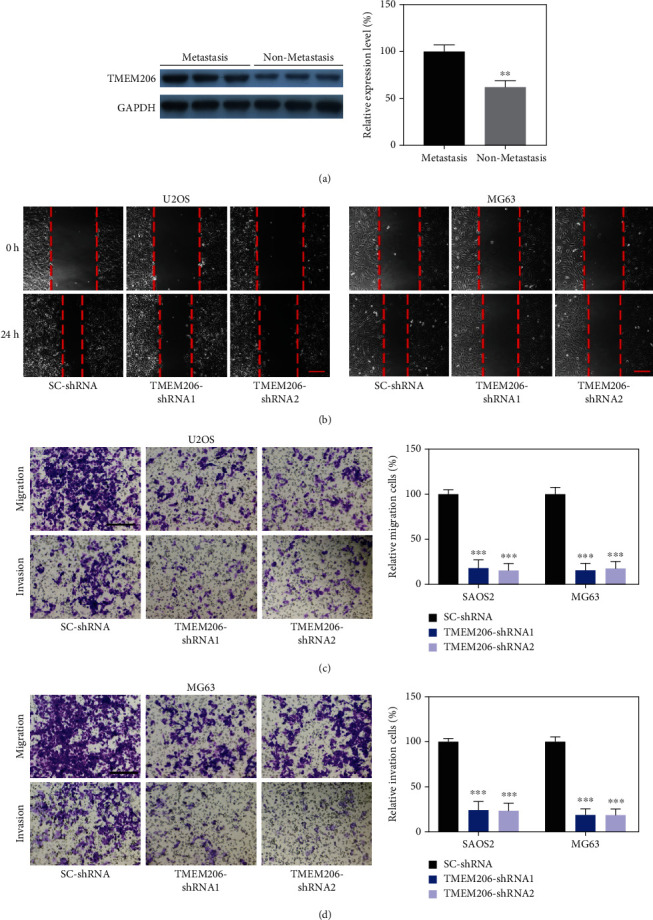
Figure 3.

TMEM206 implicated in OS cell migration and invasion. (a) Relative expression of TMEM206 in OS tissues of patients with metastasis compared with OS patients without metastasis (∗∗P < 0.01, n = 8 pair). (b) Cell migration was analyzed by the wound healing assay upon TMEM206 silencing. Scale bar: 200 μm. (c, d) Representative images and the relative number of migration or invasion cells in the Transwell chamber coated without or with Matrigel for 24 h (∗∗∗P < 0.001, as comparing with SC-shRNA group, respectively). Scale bar: 100 μm. GAPDH was used as an internal control. The data are represented as means ± SEM in (a) and represented as means ± SD in (c, d).
