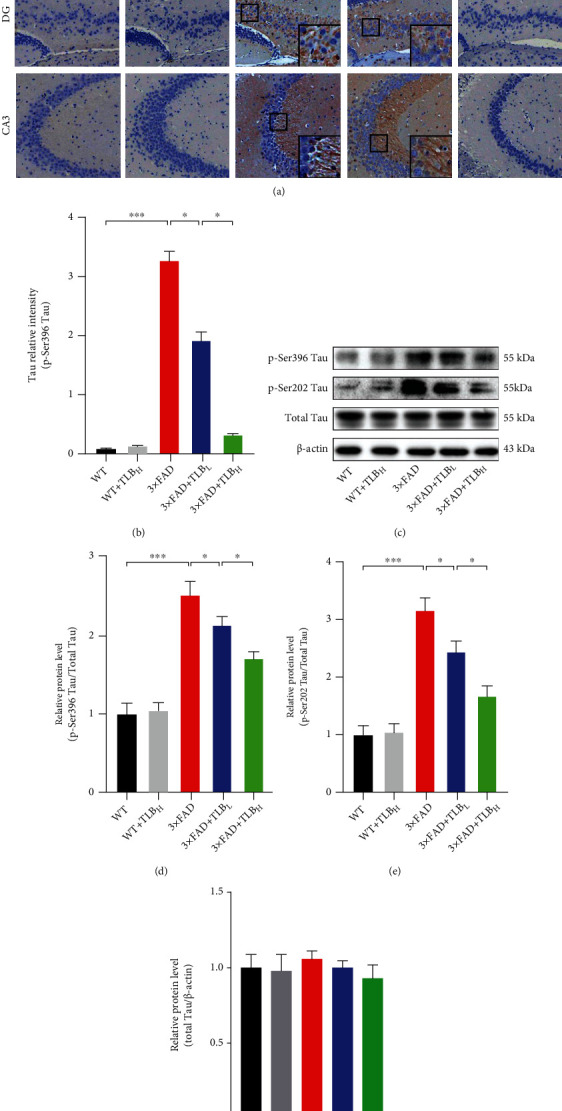
Figure 3.

TLB inhibited Tau phosphorylation in the AD mouse model. (a) Representative images of p-Ser396 Tau IHC staining. (b) Relative intensity of p-Ser396 Tau in hippocampal subregions. (c–f) Western blot and quantification for phosphorylated Tau at Ser396 and Ser202 sites and total Tau in the hippocampus. n = 6 per group. ∗p < 0.05; ∗∗p < 0.01; ∗∗∗p < 0.001.
