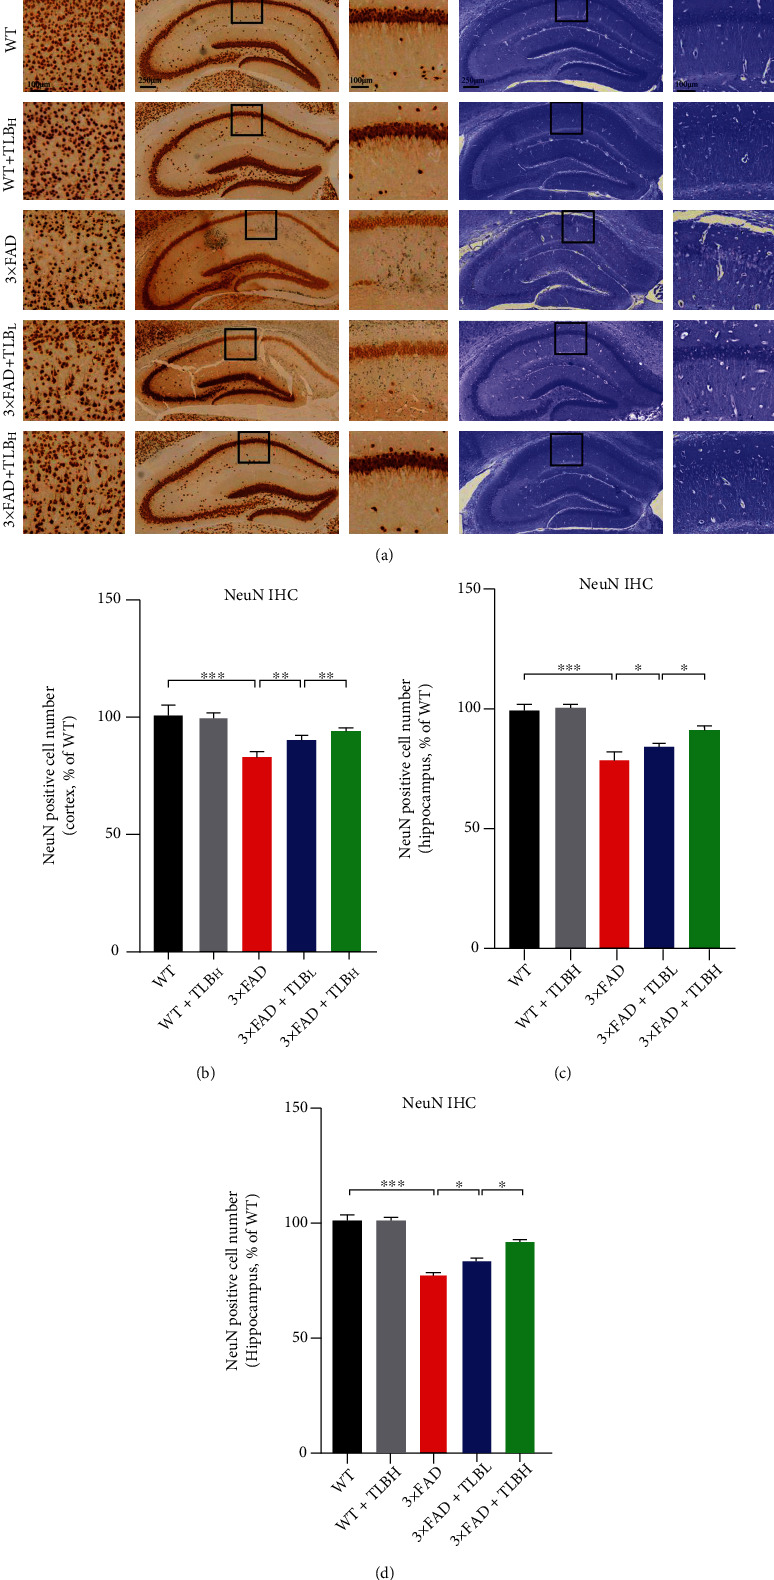
Figure 4.

TLB reduced neuronal loss in 3×FAD mice. (a) Representative figures of NeuN staining in the cortex and hippocampus and Nissl staining in hippocampal regions. (b, c) Quantification of neuronal content in the cortex and hippocampus from NeuN IHC staining results. (d) Quantitative analysis of the surviving neuron number in the hippocampus from Nissl staining results. n = 6 per group. ∗p < 0.05; ∗∗p < 0.01; ∗∗∗p < 0.001.
