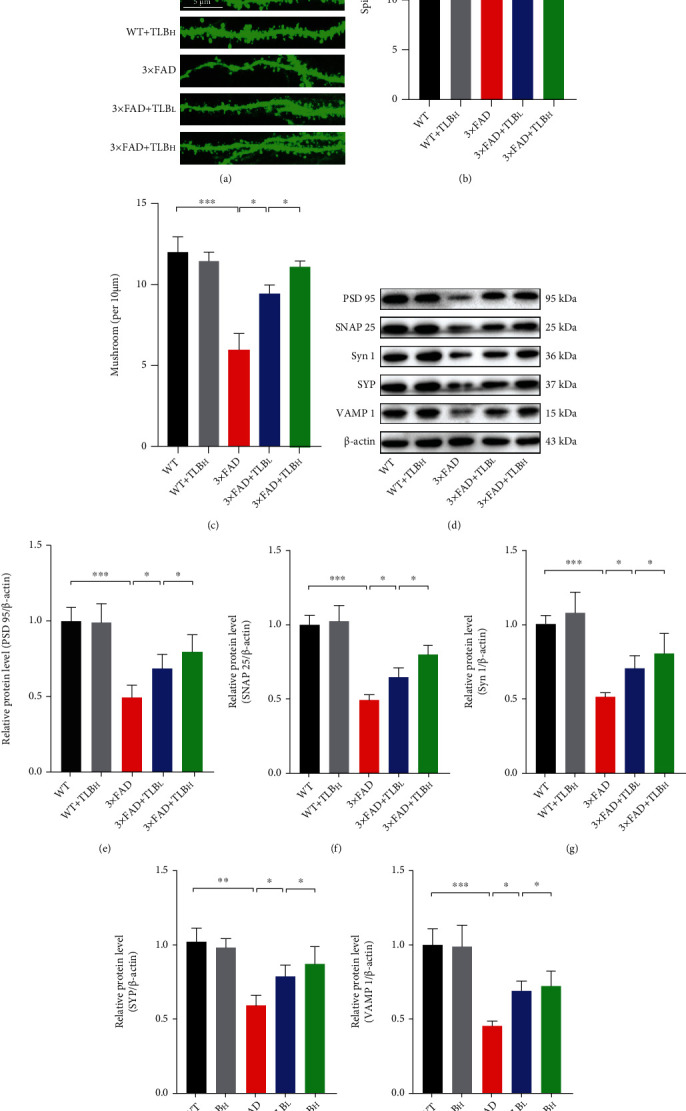
Figure 5.

TLB alleviated synaptic degeneration in AD model mice. (a) Representative images of spine morphology in each group. (b, c) Quantitative analysis of total spine density and mushroom-type spine density. (d) The representative blots of PSD95, SNAP25, Syn1, SYP, and VAMP1 in each group. (e–i) Quantitative analysis of PSD95, SNAP25, Syn1, SYP, and VAMP1 protein levels. n = 6 per group. ∗p < 0.05; ∗∗p < 0.01; ∗∗∗p < 0.001.
