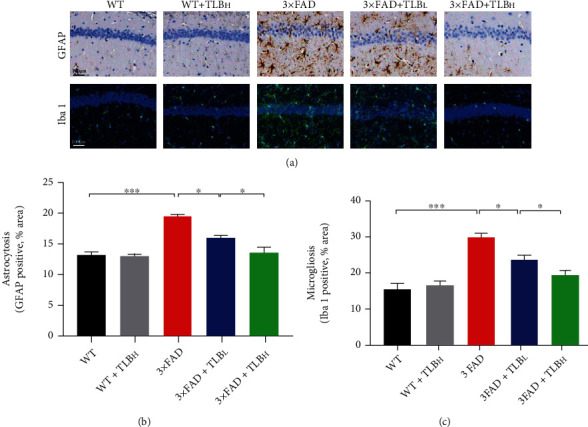
Figure 6.

TLB alleviated glial activation in AD model mice. (a) Representative images of GFAP and Iba1 staining in the hippocampal area. (b) Quantification of GFAP staining in each group. (c) Quantification of Iba1 staining in each group. n = 6 per group. ∗p < 0.05; ∗∗p < 0.01; ∗∗∗p < 0.001.
