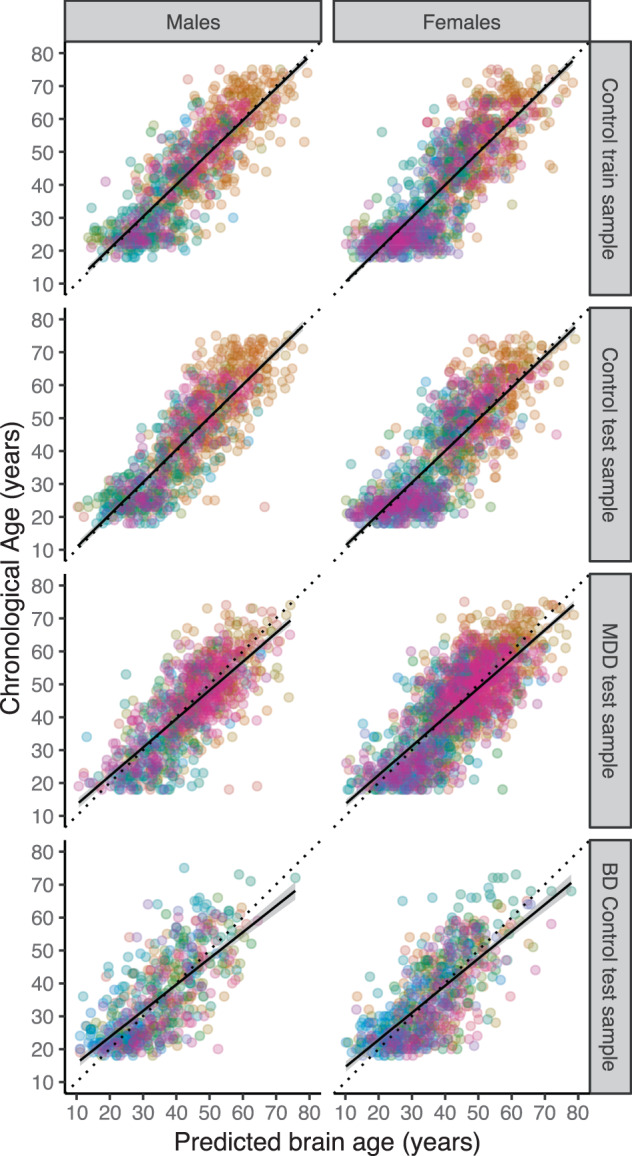
Fig. 2. Brain age prediction based on 7 FreeSurfer subcortical volumes, lateral ventricles, 34 cortical thickness and 34 surface area measures, and total intracranial volume.

The plots show the correlation between chronological age and predicted brain age in the tenfold cross-validation of the ridge regression in the control train sample, the out-of-sample validation of the test samples (controls and MDD patients) from the ENIGMA MDD working group, and generalizability to completely independent test samples (controls only) from the ENIGMA BD working group (top to bottom). The colors indicate scanning sites and each circle represents an individual subject. Diagonal dashed line reflects the line of identity (x = y).
