
Fig. 1. Common Pathway model, showing shared and specific genetic and environmental influences on the three components of sensitivity.
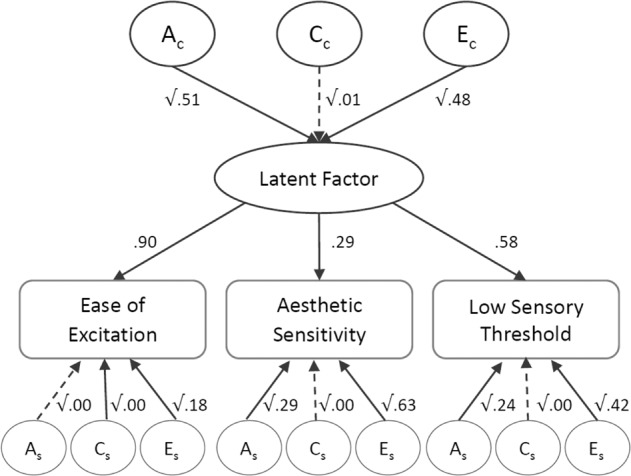
Ac common additive genetic influences, Cc common shared environmental influences, Ec common non-shared environmental influences, As specific additive genetic influences, Cs specific shared environmental influences, Es specific non-shared environmental influences. The pathways from common ACE influences to the latent factor represent the standardized ACE estimates for the latent factor of sensitivity (A = 0.51, C = 0.01, E = 0.48). The pathways from the latent factor to the three components indicate the amount of variance explained in each component by the latent factor (ease of excitation = 90%, aesthetic sensitivity = 29%, low sensory threshold = 58%). The pathways from specific ACE influences to the components represent the standardized ACE estimates that are specific to each component. Dashed lines represent non-significant paths.