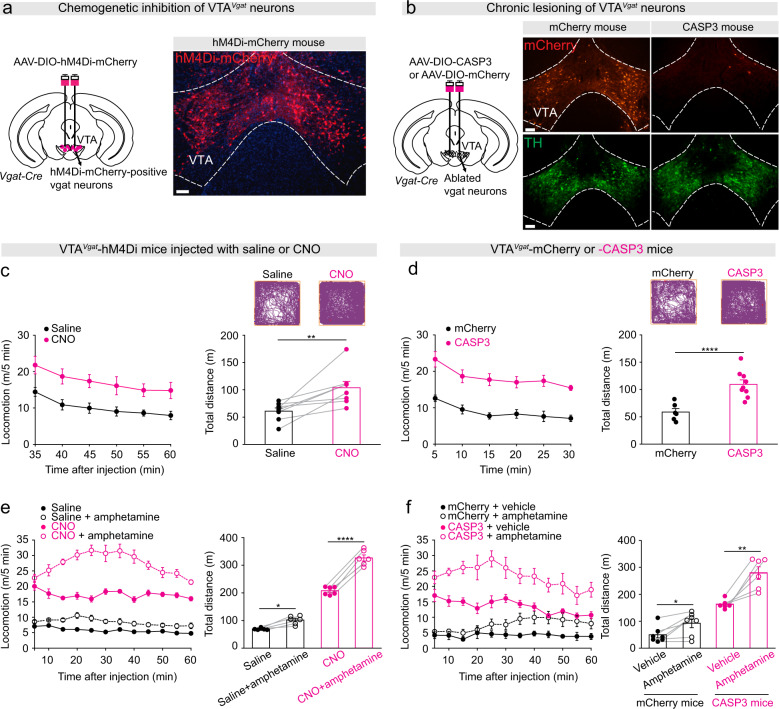
Fig. 1. Selective inhibition or lesioning of VTAVgat neurons increased locomotor activity and sensitivity to D-amphetamine-induced hyperlocomotion.
a Generation of VTAVgat-hM4Di mice. Staining by immunohistochemistry (mCherry, red) for hM4Di-mCherry expression in the VTA. Scale bar: 150 μm. b Generation of VTAVgat-CASP3 and VTAVgat-mCherry control mice. Immunohistochemical staining for mCherry (red) and dopamine neurons (TH, tyrosine hydroxylase, green) in the VTA of control mice that expressed mCherry in VTAVgat neurons (left-hand images), or in mice where VTAVgat neurons were lesioned with caspase (right-hand images). Scale bar: 150 μm. c Video-tracked paths, locomotion speed and distance traveled of VTAVgat-hM4Di mice (n = 8 mice) following CNO (1 mg/kg) injection compared with saline injection in the open field over a 30-min period. Paired t-test, t (7) = −3.68, **p = 0.007. d Video-tracked paths, locomotion speed and distance traveled of VTAVgat-mCherry (n = 8 mice) and VTAVgat-CASP3 mice (n = 9 mice) in the open field over a 30-min period. Unpaired t-test, t(15) = −5.43, ****p = 0.00006. e Locomotion speed and distance traveled of VTAVgat-hM4Di mice (n = 6 mice) in the open field after saline or D-amphetamine injection (subsequent to saline or CNO injection). Repeated measures two-way ANOVA and Bonferroni-Holm post hoc test. F(1,5) = 66. Saline vs. saline + amphetamine t(5) = 3.69, *p = 0.01; CNO vs. CNO + amphetamine t(5) = 13.6, ****p = 0.000038. f Locomotion speed and distance traveled in the open field test of VTAVgat-mCherry (n = 7 mice) or VTAVgat-CASP3 mice (n = 6 mice) after vehicle or D-amphetamine injection. Two-way ANOVA and Bonferroni-Holm post hoc test. F(mCherry or CASP3) = 93; F(saline or amphetamine) = 26; F(interaction) = 5.64; mCherry + vehicle vs. mCherry + amphetamine t(6) = −3.39, *p = 0.01; CASP3 + vehicle vs. CASP3 + amphetamine t(5) = −4.97, **p = 0.004. All error bars represent the SEM.

