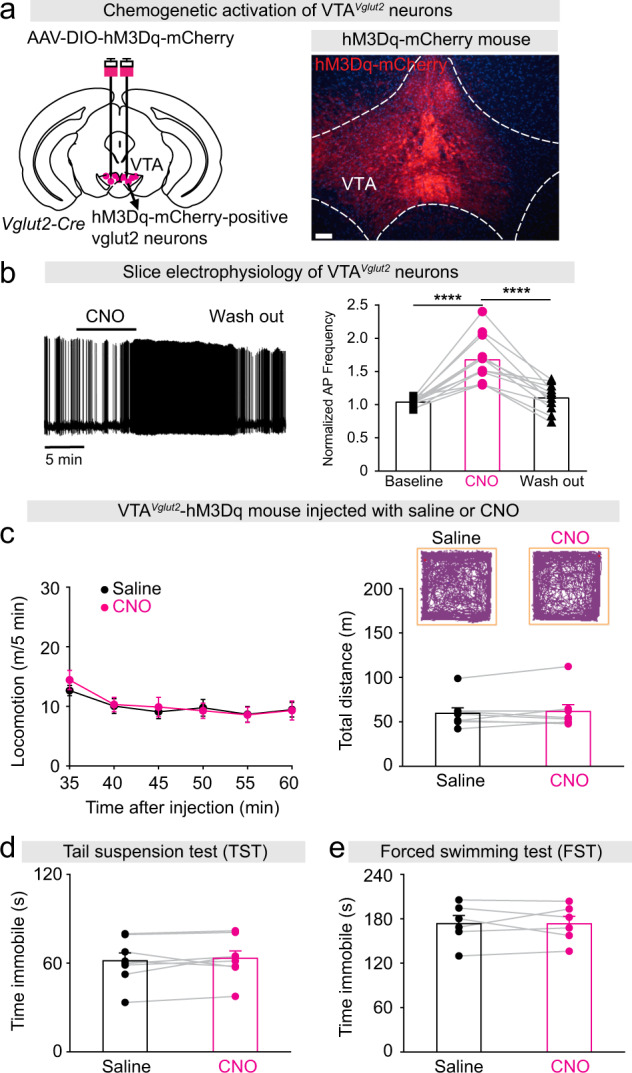
Fig. 4. Activation of VTAVglut2 neurons does not produce mania-like behaviors.

a Generation of VTAVglut2-hM3Dq mice. Staining by immunohistochemistry (mCherry) for hM3Dq-mCherry expression in the VTA. Scale bar: 150 μm. b Example of a spontaneously active VTA glutamatergic neuron with action potential firing before, during and after CNO application in an acute brain slice prepared from a VTAVglut2-hM3Dq mouse. The bar graph shows the average normalized frequency of action potentials of all cells recorded. One-way repeated ANOVA and Bonferroni-Holm post hoc test. F(baseline CNO washout) = 35, baseline vs. CNO t(22) = 7.64, ****p = 1E-7, CNO vs. washout t(22) = 6.91, ****p = 6E-7, baseline vs. washout t(22) = 0.72, p = 0.4. c Video-tracked paths, locomotion speed and distance traveled of VTAVglut2-hM3Dq mice (n = 8 mice) following CNO (1 mg/kg) injection compared with saline injection in the open field arena over a 30-min period. Paired t-test, t(7) = −0.72, p = 0.49. d Immobility time during the tail suspension test (TST) of VTAVglut2-hM3Dq mice (n = 8 mice) after saline or CNO injection. Paired t-test, t(7) = −0.73, p = 0.88. e Immobility time during the forced swimming test (FST) of VTAVglut2-hM3Dq mice (n = 6 mice) after saline or CNO injection. Paired t-test, t(4) = −0.01, p = 0.98.
