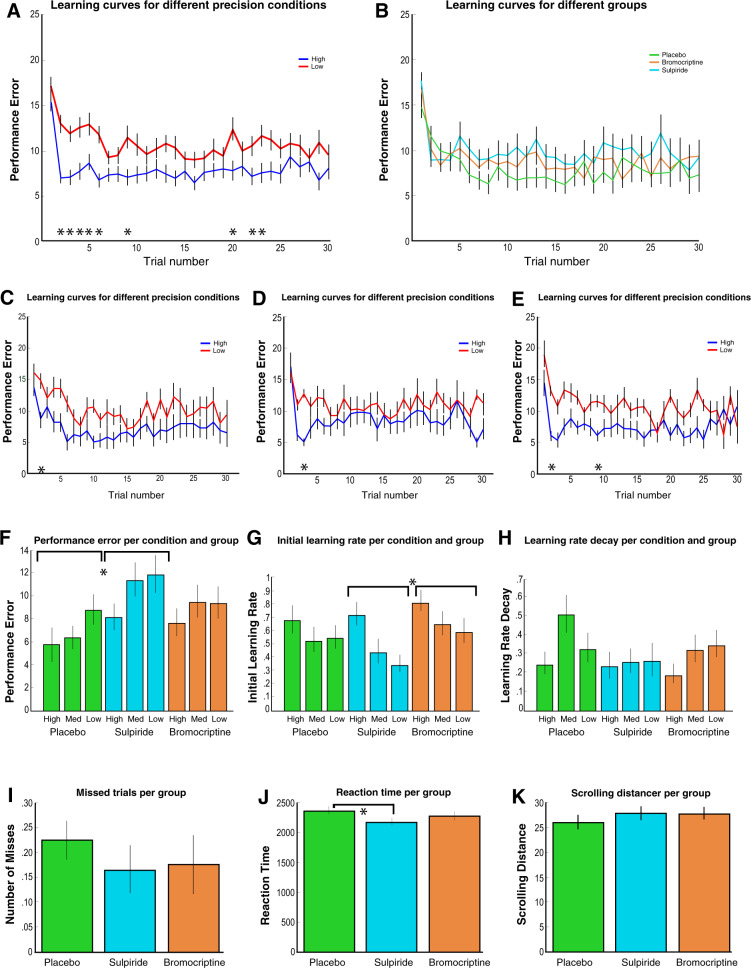
Fig. 2. Behavioural results for the dopamine study.
a–e display the average learning curves, reflecting the absolute distance between the actual mean of the distribution and participants’ estimate of the mean distribution over 30 trials averaged over the three sessions for each participant. The distance between the prediction and the actual mean of the distribution defines performance error. Therefore, lower values of performance error are better. Asterisks indicate Bonferroni-corrected significant differences across conditions. a Performance was significantly better in the high-precision condition compared with the low-precision condition when combing all participants, especially at the beginning of the experiment. b There were no clear differences between groups when analysing trial-by-trial performance. The placebo (c), sulpiride (d) and bromocriptine (e) group showed only a significant difference between the precision conditions one or two trials in the beginning of the experiment. f Averaging performance error across all trials, we see overall better performance in the placebo condition compared with the sulpiride condition, and higher performance in more precision conditions. g Initial learning rate parameters are displayed here for the Pearce–Hall model. Initial learning rates were higher in the Bromocriptine condition compared with the sulpiride condition. h Learning rate decay parameters from the Pearce–Hall model are displayed here. Precision and group did not affect the learning rate decay parameter. i No differences were found in number of missed trials, and k scrolling distance. j Reaction times were quicker in the sulpiride group. Error bars represent standard error of the mean.

