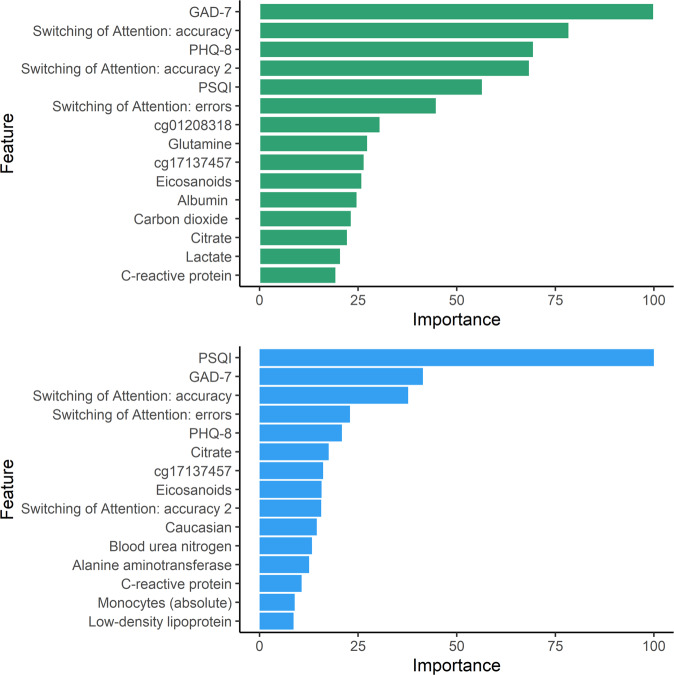
Fig. 3. Display of the top 15 predictor variables for predicting LGMM trajectories (green bars) and for predicting provisional PTSD diagnosis (blue bars).
In permutation-based ranking [34], the importance of a feature is measured by calculating the increase in the model’s prediction error after reshuffling the distribution of the feature values. The y-axis presents the importance ranking, with the top features being the most important ones. The x-axis denotes the classification error scaled to range 0 to 100. It is not recommended to interpret the absolute importance value, but only the rank order between features [75]. All features shown in Fig. 3 contributed significantly (p < 0.01) to the respective predictive model [34]. Statistical significance is indicated by the bias-correcting PIMP algorithm, which tests the importance of each predictor under the distribution of “null importance” values derived for every variable from 100 permutations of the response variable [34].

