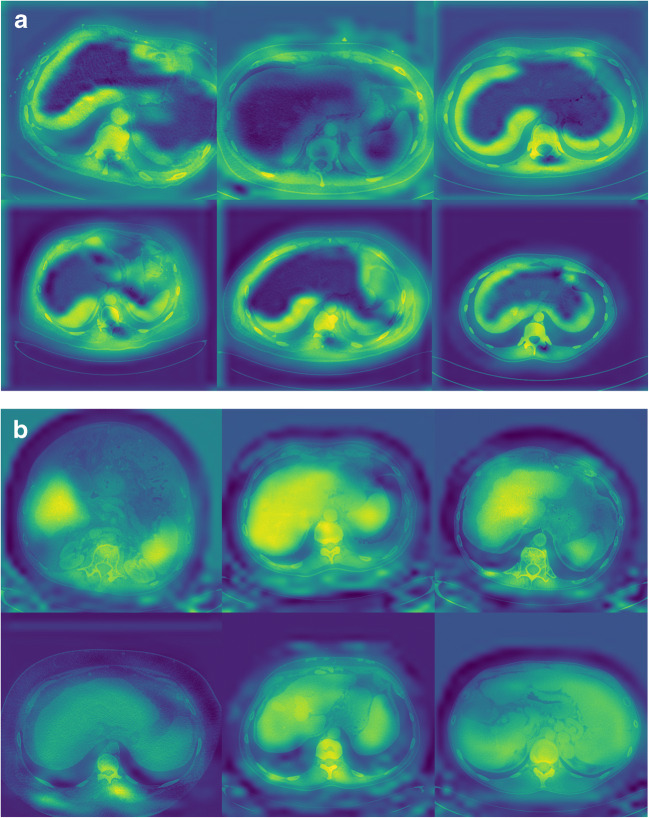
Fig. 4.
a Shown are location maps overlaid on axial computed tomography images of the upper abdomen at different levels in patients without liver fibrosis (stage F0). The liver surface is highlighted in these location maps, which indicates that information exploited from the liver surface contributed to the convolutional neural network's prediction of F0 liver fibrosis. b Shown are location maps overlaid on axial computed tomography images of the upper abdomen at different levels in patients with cirrhosis (stage F4). The liver parenchyma and spleen are highlighted in these location maps, which indicates that information exploited from the liver parenchyma and spleen contributed to the convolutional neural network’s prediction of F4 liver fibrosis (cirrhosis)

