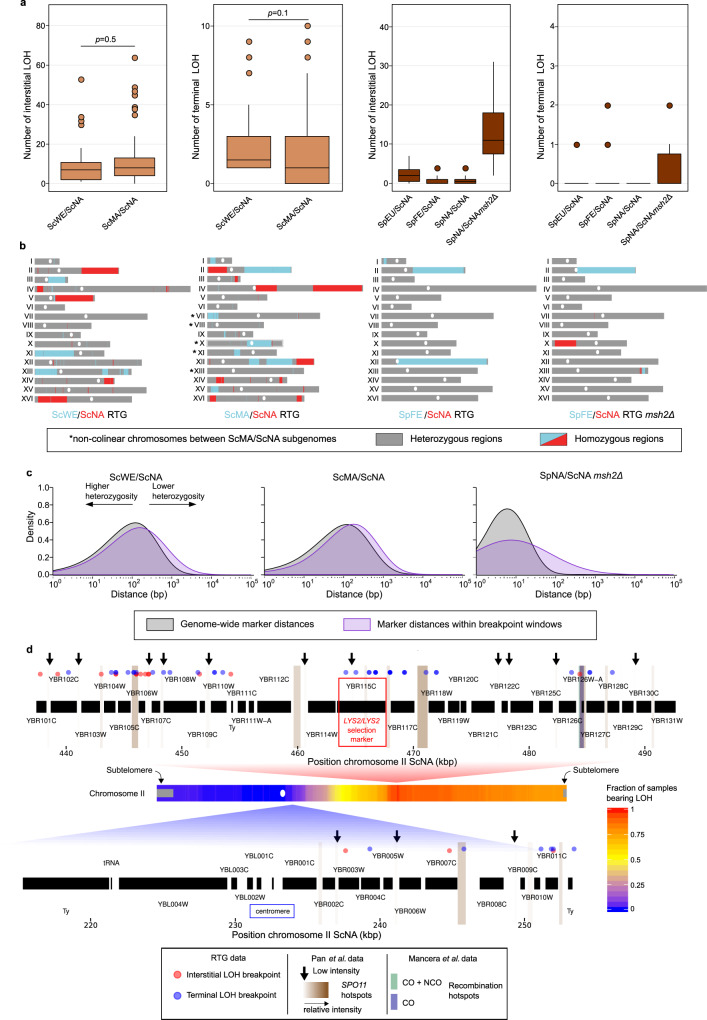
Fig. 3. LOH landscape of hybrids evolved through RTG.
a Left panels: boxplots of the number of interstitial and terminal LOHs in intraspecies hybrids. We detected no significant difference in the number of interstitial or terminal events comparing the ScWE/ScNA (n = 24) and the ScMA/ScNA (n = 125) data sets (two-sided Wilcoxon rank-sum test, p value = 0.5 and p value = 0.1, respectively). Right panels: boxplots of the number of interstitial and terminal LOHs in interspecies hybrids. Colour code as in Fig. 2a. b Genome-wide LOH patterns for two RTG-evolved intraspecies hybrids (left) and two evolved interspecies hybrids (right). All plots are based on the ScNA reference genome. c Distribution of the distances between consecutive markers, genome-wide (grey) and in LOH breakpoint windows (purple), across three different hybrids. LOH breakpoint windows comprise the five heterozygous markers and the five homozygous markers closer to the breakpoint. d Association between meiotic recombination and LOH breakpoints regions within two segments of chromosome II. LOH breakpoint regions are defined e.g. as the genomic interval between the first homozygous marker of a LOH region and the closest flanking marker which does not belong to the same LOH region. The colour intensity of Spo11p hotspots is proportional to the corresponding signal intensity. The heatmap of the LOHs (i.e., two copies of ScNA alleles) resulting from the breakpoints is also reported. The boxplot is defined as follows: the box is delimited by the first quartile (Q1) and the third quartile (Q3). The line that separates the box is the median. Whiskers are defined as: upper whisker = min(max(x), Q3 + 1.5 × IQR); lower whisker = max(min(x), Q1–1.5 × IQR), where: x is the data, Q1 is the first quartile, Q3 is the third quartile and IQR is the interquartile range (IQR = Q3−Q1).

