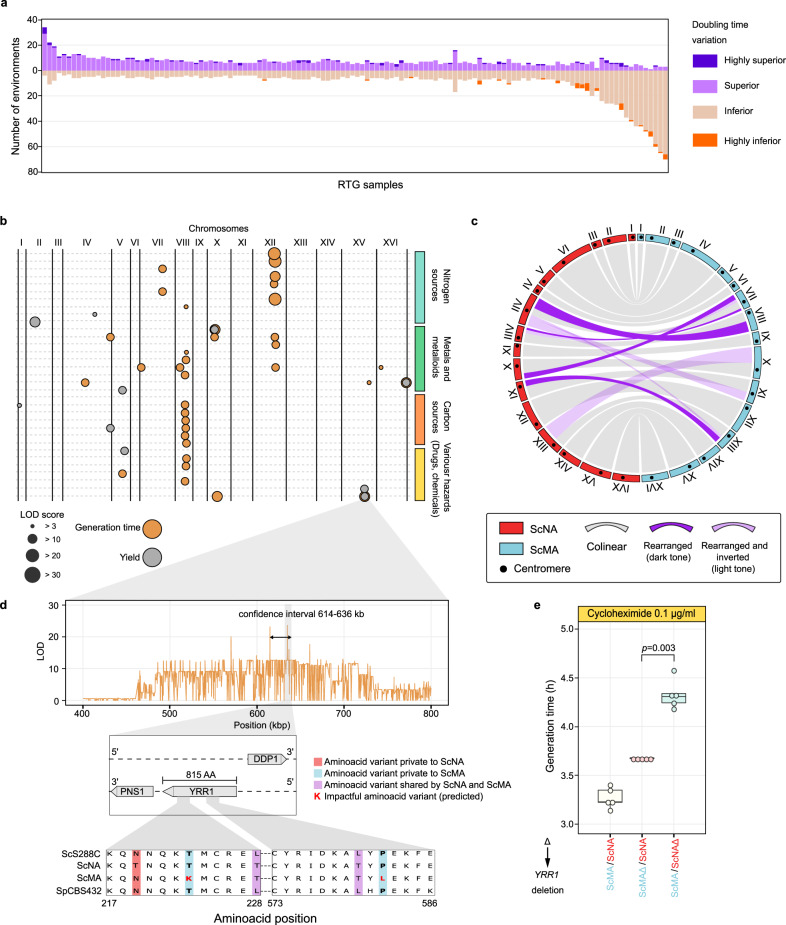
Fig. 4. Fitness diversification of RTG clones and QTL mapping.
a Extent of fitness variation in the ScMA/ScNA data set. The y axis shows the number of environments in which the cell doubling time of the RTG clone is superior or inferior compared with the ScMA/ScNA parent hybrid. b QTLs mapped across the environments. Only conditions where QTLs were detected are reported. c Circular plot representing the rearrangements between the two subgenomes of the ScMA/ScNA hybrid. Regions are considered inverted if they do not resemble the ancestral centromere–telomere orientation. d Linkage scan for growth in media containing cycloheximide. Zoom-in on chromosome XV QTL and the two highly conserved regions of YRR1 with two amino-acids substitutions predicted to be deleterious. e Boxplot of doubling times in cycloheximide for the parental ScMA/ScNA strains (five replicates) and the two hemizygous strains (five replicates). The deletion of either allele reduces growth in cycloheximide compared with the WT, underlying YRR1 haploinsufficiency in this background. The deletion of the ScNA allele is significantly worse (one-tailed Wilcoxon rank-sum test p value = 0.003) than the ScMA. The boxplot is defined as follows: the box is delimited by the first quartile (Q1) and the third quartile (Q3). The line that separates the box is the median. Whiskers are defined as: upper whisker = min(max(x), Q3 + 1.5 × IQR); lower whisker = max(min(x), Q1–1.5 × IQR), where: x is the data, Q1 is the first quartile, Q3 is the third quartile and IQR is the interquartile range (IQR = Q3−Q1).

