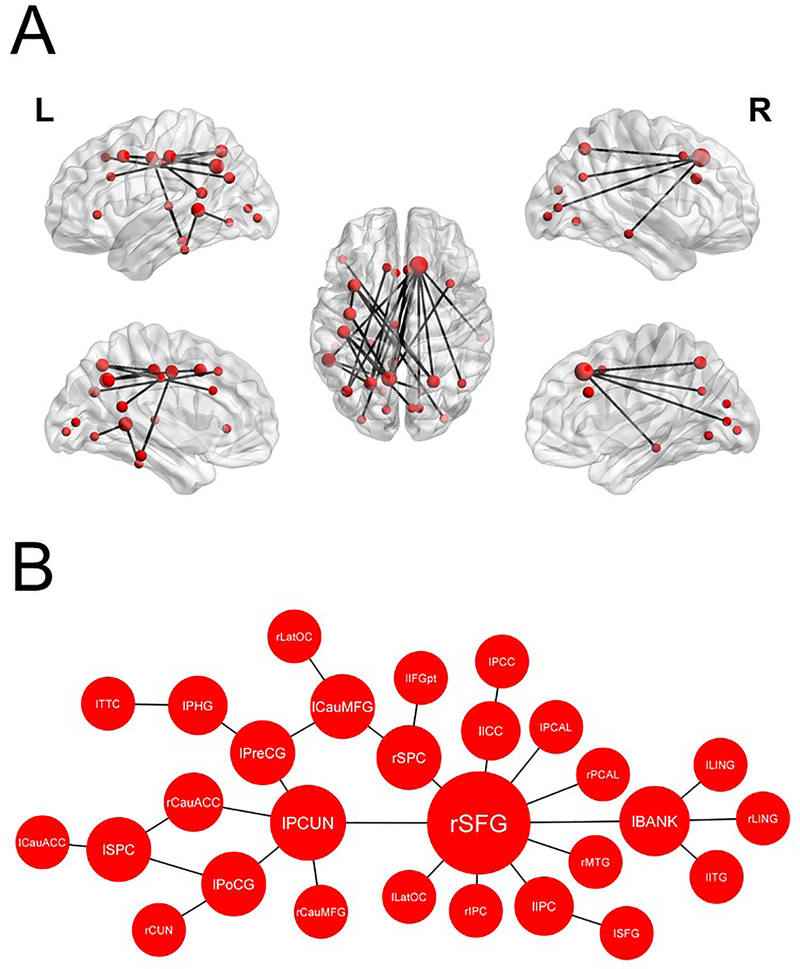
Figure 2: Subnetwork of functional connectivity in the alpha band during tic suppression.
Nodes depicted in this figure showed increased connectivity during tic suppression in comparison to rest. Node size corresponds to connectivity degree (number of connections per node). (A) Hubs in this network were the right superior frontal gyrus (10 connections, degree z-score: 4.2), the left precuneus (5 connections, degree z-score: 1.5), and the left banks of superior temporal sulcus (4 connections, degree z-score: 1.01). (B) Graphical representation of the alpha-band subnetwork. Note: “l” & “r” denotes the lateralization of the nodes; CauACC: caudal anterior cingulate cortex, CauMFG: caudal middle frontal gyrus, CUN: cuneus, ICC: isthmus of the cingulate cortex, IFGpt: pars triangularis of the inferior frontal gyrus, IPC: inferior parietal cortex, ITG: inferior temporal gyrus, LatOC: lateral occipital cortex, LING: lingual gyrus, MTG: middle temporal gyrus, PCAL: pericalcarine cortex, PCC: posterior cingulate cortex, PCUN: precuneus, PHG: parahippocampal gyrus, PoCG: postcentral gyrus, PreCG: precentral gyrus, SFG: superior frontal gyrus, SPC: superior parietal cortex, TTC: transverse temporal cortex.

