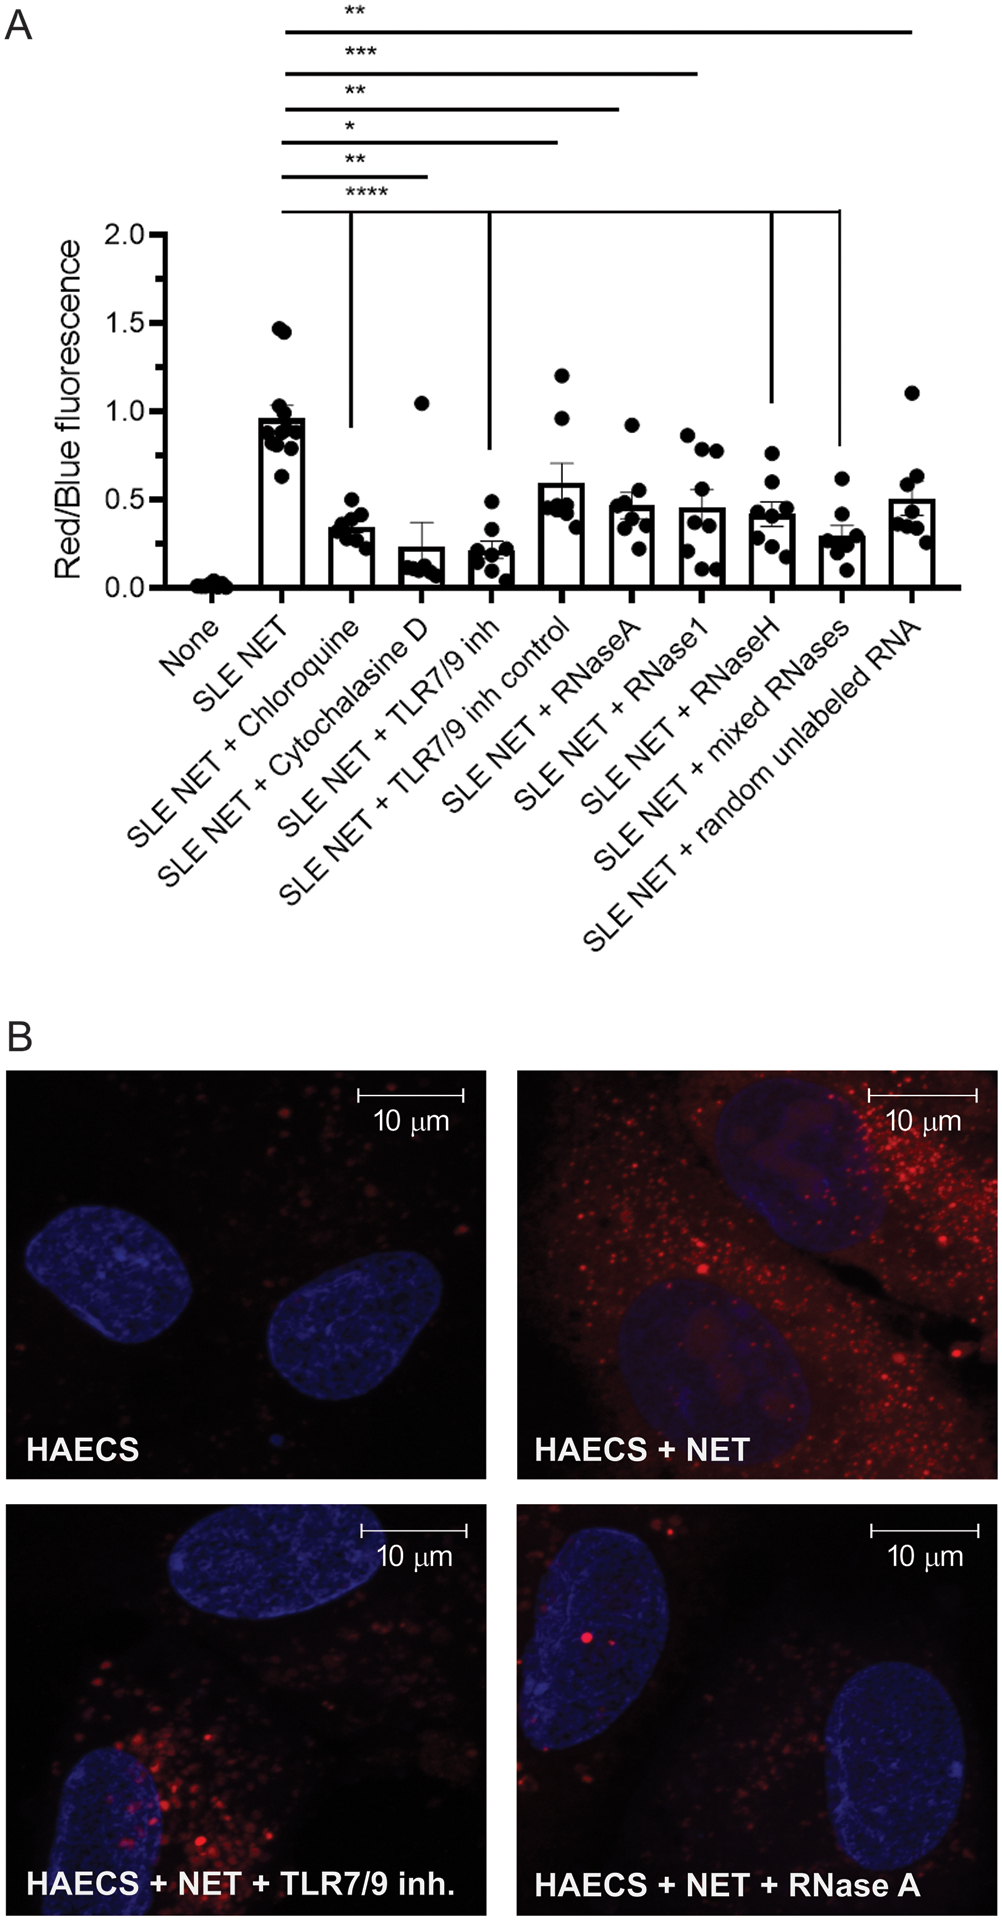
Figure 4: Uptake of NET-bound total RNA by endothelial cells depends on the actin cytoskeleton and endosomal TLRs.

Hoechst (blue) was used to quantify number of cells in A and to label nuclei in B. Shown in (A) is the ratio between Exo Glow red fluorescence staining internalized total RNA derived from NETs and blue fluorescence from Hoechst staining DNA both quantified by plate assay and fluorometry. (B) Representative images of similarly stained HAECs with total RNA in NETs stained with the Exo Glow red dye by laser confocal. Upper images: HAECs alone (left); HAECs plus NETs (middle); HAECs plus NETs in the presence of TLR7/9 inhibitor (right). Lower images: HAECS plus NETs and RNase A (left); HAECs plus NETs and RNase 1 (middle); HAECs plus NETs and all RNases combined (right). Bar graphs represent the mean ± SEM of three independent experiments. Statistical significance was analyzed by Mann-Whitney U test *: p<0.05; ** p<0.01. Magnifications in images are 126x and scale bars in images correspond to 10 um.
