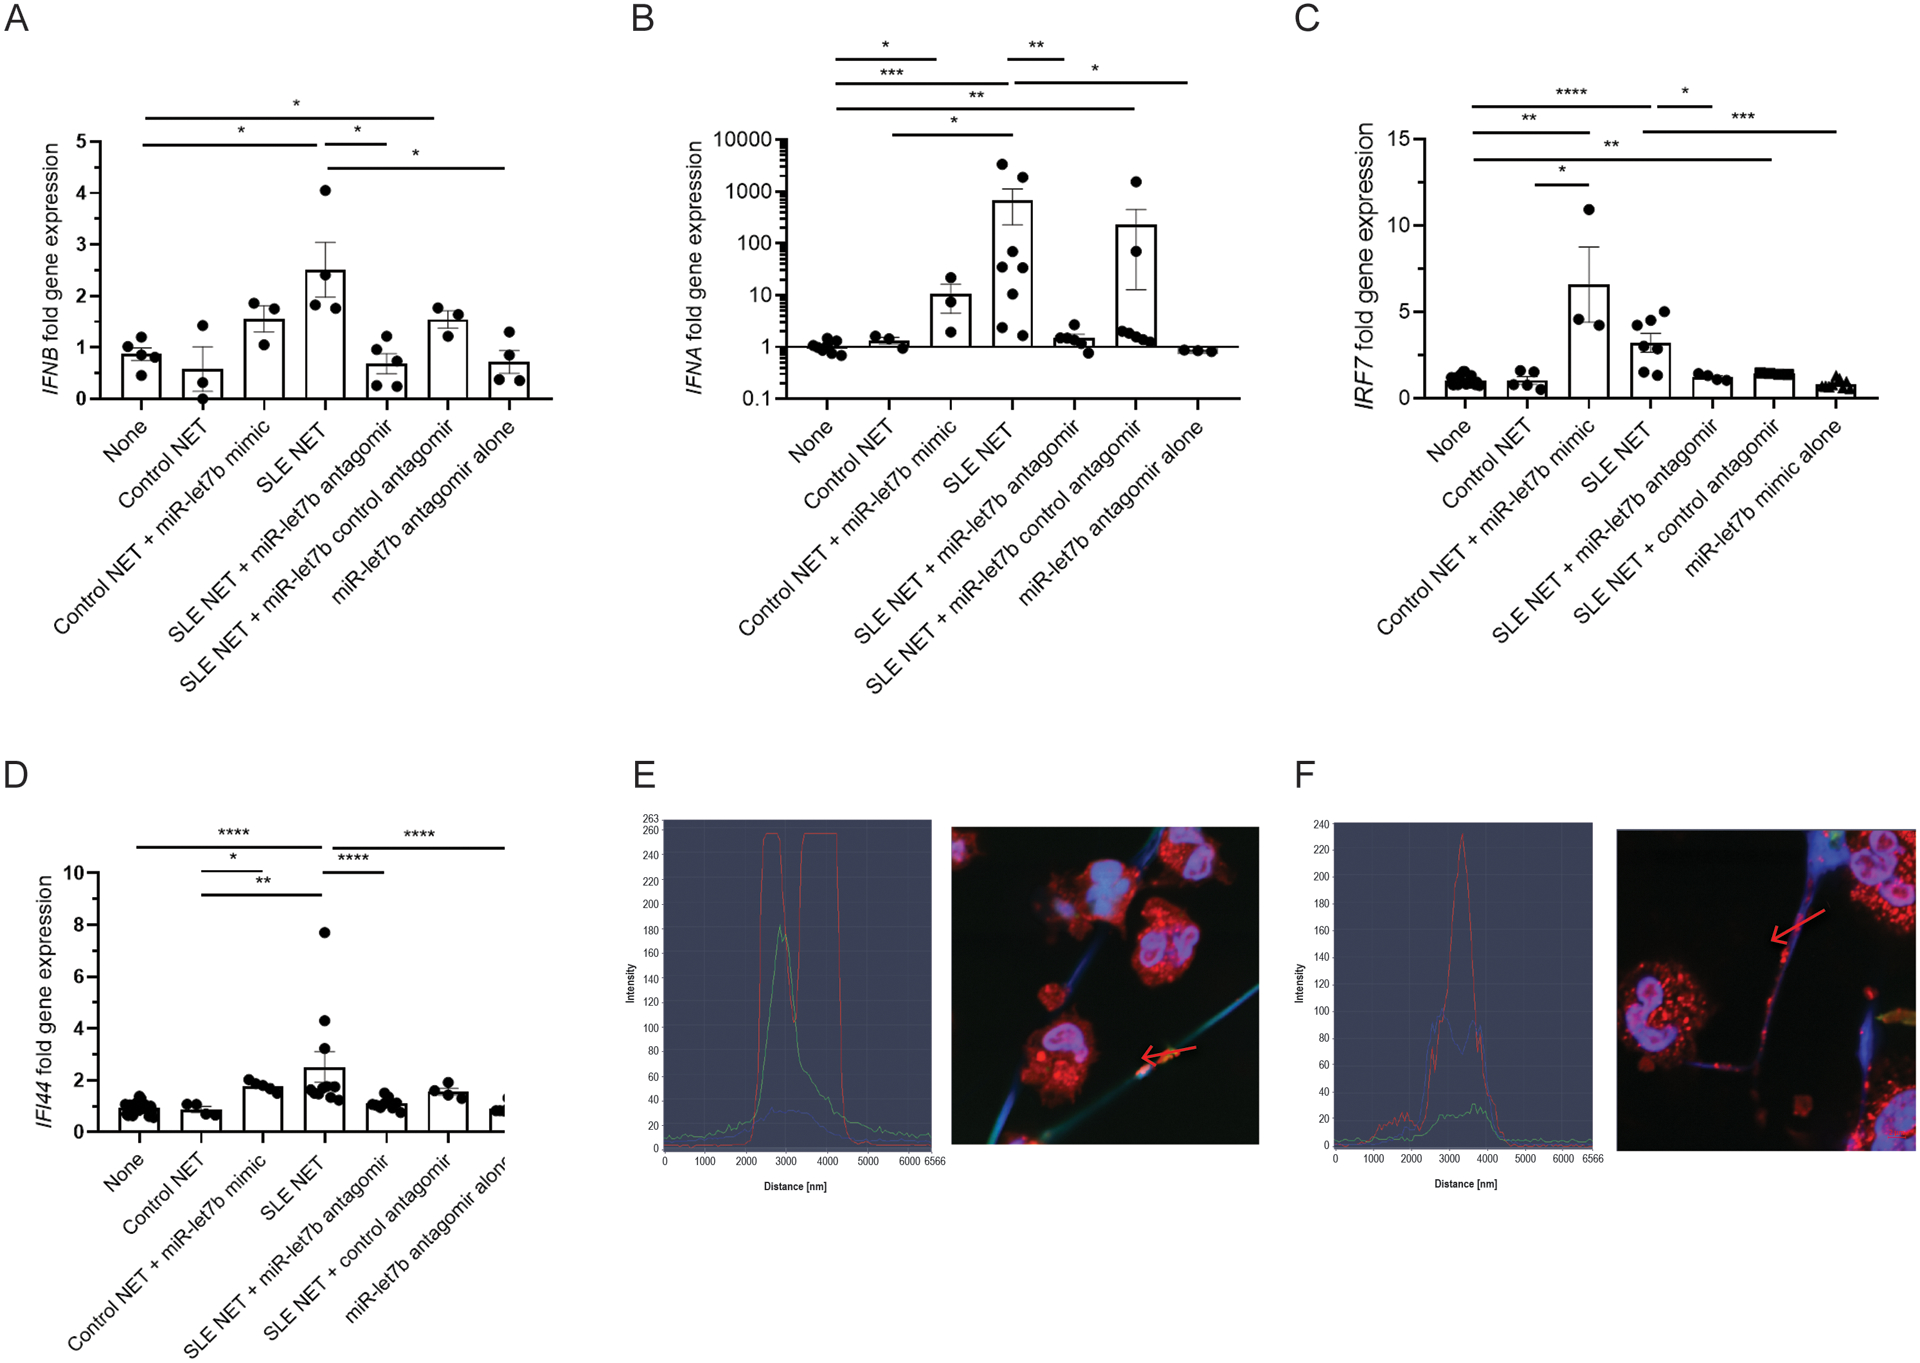
Figure 6: miR-let7b present in NETs induces type I IFN responses in endothelial cells.

A) IFNB, B) IFNA, C) IFI44, and D) IRF7 gene expression in HAECs quantified after 6 h (A) and 24 h (B, C, D) coincubation with NETs from SLE (average LDG and NDG) or HC NDGs (control NET) in the presence or absence of the antagomir for miR-let7b and control antagomir. Results also display the effect of an miR-let7b mimic added to HC NETs or the antagomir alone. In NETs, HMGB1 colocalizes with total RNA (E and F). NETs and nuclei are stained with Hoechst (blue), HMGB1 (red) and total RNA (SYTO dye green). Representative images are from SLE (E) LDG or (F) NDG cells and NETs. Left portion of the images depicts plots of profile fluorescence quantification through the red arrow depicted on the NET (included in each image). Results are representative of 3 independent experiments.
