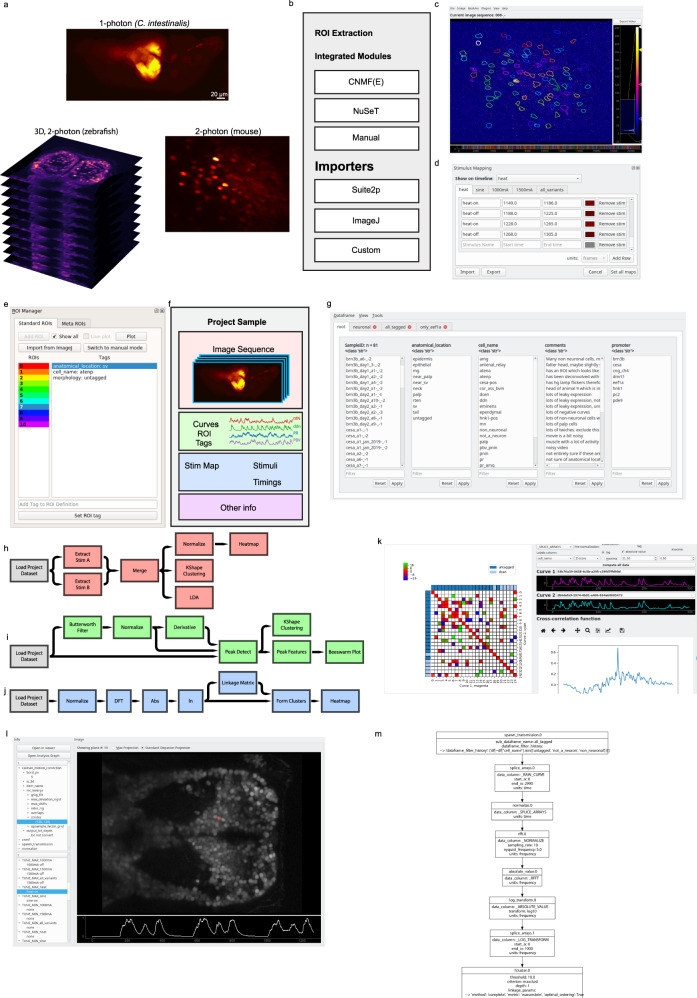
Fig. 1. Mesmerize platform overview.
a Raw imaging data that can originate from a variety of sources; examples shown from 1-photon calcium imaging of Ciona intestinalis, 2-photon imaging of the mouse visual cortex neurons and volumetric 2-photon imaging of zebrafish. b Mesmerize’s highly modular design allows ROI extraction to be performed through a variety of methods such as CaImAn CNMF(E), NuSeT deep learning, or manually. ROIs can also be imported from Suite2p, ImageJ, or a custom module can be written using the API to import ROIs from other sources. c The Mesmerize Viewer lets users explore their imaging data and integrates with various viewer modules such as: d Stimulus Mapping module which allows users to map temporal information, such as stimulus or behavioral periods; e ROI Manager that can work with ROIs originating from a variety of sources, as shown in (b), and allows users to tag an unlimited variety of categorical information such as anatomical location, cell type, morphology, etc. for each ROI. f All data pertaining to an imaging session, i.e. the image sequence, calcium curves, ROIs, tags (annotations), stimulus mappings, and all other categorical information are packaged into a Project Sample and saved to the Project Dataset. g The samples within a Project Dataset can be interactively managed using the Project Browser. h–j Project Datasets, or sub-datasets, can be loaded into a flowchart to interactively perform downstream analysis. Simplified examples of how flowcharts can be used to h explore stimulus or behavioral responses, i analyze peak features (width, amplitude, slope etc.) or perform k-shape clustering and j perform hierarchical clustering. k Downstream analysis in flowcharts are integrated with various forms of highly interactive plots such as cross-correlation analysis. Many interactive plots are associated with a l Datapoint Tracer where users can click on individual datapoints to view the spatial location of the ROI that it originates from, along with all other data associated with that datapoint. m The Datapoint Tracer shown in (l) also lets users view the analysis history log for every datapoint in the form of an Analysis Graph.

