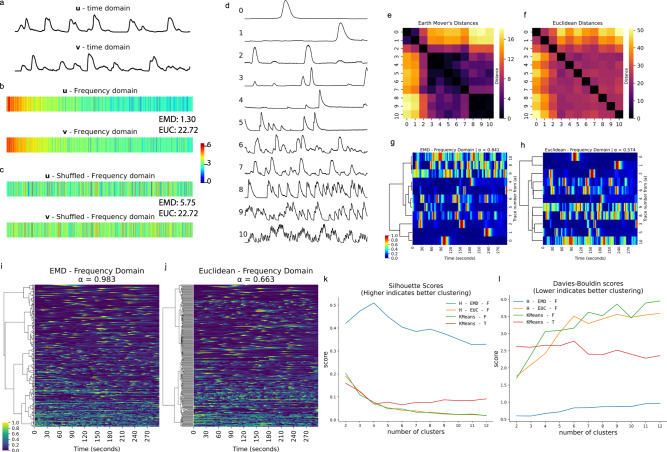
Fig. 4. The Earth Mover’s Distance is a robust metric for broadly characterizing calcium activity.
a Two example calcium traces, u and v, in the time domain. b Discrete Fourier transforms (DFTs) of u and v are used as feature vectors. The Earth Mover’s Distance (EMD) between u and v is 1.30, the Euclidean (EUC) distance between u and v is 22.72. c A random shuffle is applied to feature vectors u and v. The Earth Mover’s Distance (EMD = 5.75) changes after the random shuffle; however, the Euclidean distance (EUC = 22.72) is identical. This demonstrates how the order of elements along a feature vector is captured by the EMD, which is necessary for effectively comparing DFTs. Color bar for (b) and (c) indicates square root of energy. d Eleven example calcium traces from C. intestinalis. e Distance matrix showing EMDs between DFTs of the 11 calcium traces from (d). f Distance matrix showing Euclidean Distances between DFTs of the 11 calcium traces from (d). g Dendrogram constructed from (e), with a high agglomerative coefficient (α ≈ 0.841, best = 1, worst = 0) indicating good hierarchical clustering. h Dendrogram constructed from (f), with a low agglomerative coefficient (α ≈ 0.574), indicating poor hierarchical clustering. Color bar for (g) indicates normalized fluorescence intensity for (g) and (h). i, j Dendrograms showing hierarchical relationships between over 200 calcium traces. Color bar indicates min-max normalized fluorescence. i Dendrogram calculated using EMD, showing a very high agglomerative coefficient (α ≈ 0.983) that indicates good clustering performance. Cells near the top of the tree show slow and sparse calcium dynamics, cells closer to the bottom of the tree show much more active and complex calcium dynamics. j Dendrogram calculated using Euclidean distances, showing a moderate agglomerative coefficient (α ≈ 0.663). k Silhouette scores comparing clustering performance of various methods, higher scores indicate better, performance. Hierarchical clustering using the EMD between DFTs outperforms other methods. l Davies−Bouldin scores comparing clustering performance of various methods; lower scores indicate better clustering performance. This score also demonstrates that hierarchical clustering using the EMD between DFTs outperforms other methods. Abbreviations from (l) are defined in Supplementary Table 2.

