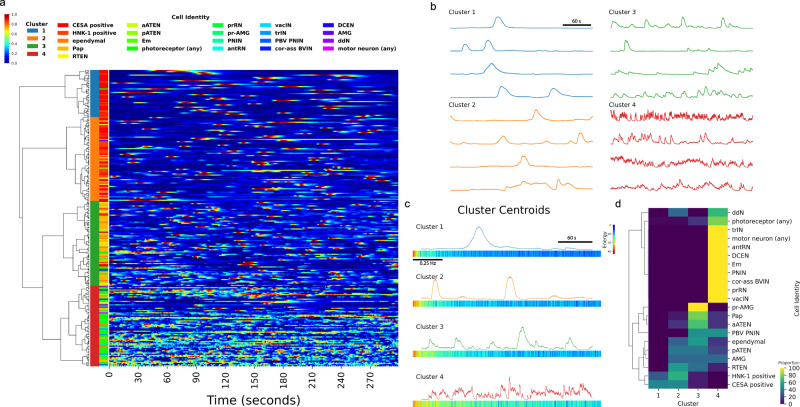
Fig. 5. Spontaneous calcium dynamics in C. intestinalis reveals cell-type signatures.
a Hierarchical clustering of calcium dynamics observed in neuronal and non-neuronal cells within the head of C. intestinalis. Dendrogram shows hierarchical relationships. Top left color bar indicates the min−max normalized fluorescence intensity scale used for the heatmap. Left color bar legend between the dendrogram and heatmap indicates cluster membership. Right color bar legend indicates cell identity. Heatmap shows normalized traces. b Example traces from each cluster. c Cluster centroids in both the time domain (top) and frequency domain (bottom). d Proportion of cells that appear in each of the four clusters. For each cell type, proportions sum up to 100% across all four clusters. Cell-type abbreviations are defined in Supplementary Table 3.

