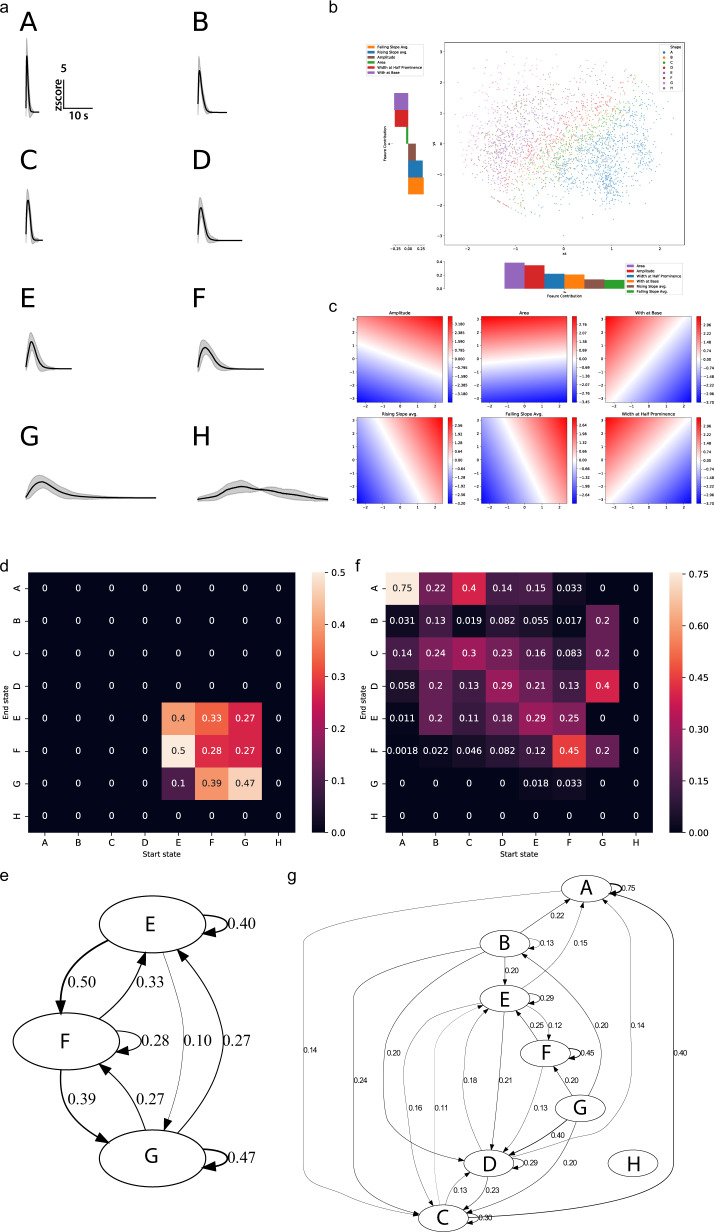
Fig. 6. k-Shape clustering and Markov chains.
a Cluster means from k-Shape clustering of peaks from neuronal and non-neuronal cells in the head of C. intestinalis. Clusters are assigned alphabetical labels according to their half-peak width. Error bands show within-cluster standard deviation. b PCA of peak-features showing how k-Shape clustering maps onto the PCA space. c Inverse transform for each of the input features showing the characteristics of the PCA space. Color intensity and the color bar scales indicate the magnitude of the corresponding feature. d State transition matrix of a Markov chain created from discretized sequences of HNK-1 cell calcium traces and the corresponding (e) state transition graph. f State transition matrix of a Markov chain created from discretized sequences of photoreceptor cell calcium traces and the corresponding (g) state transition graph. Color bar scales in (d) and (f) are transition probability. Numbers on the transition graphs in (e) and (g) also show transition probability. Transition probabilities < 0.1 were excluded to reduce visual clutter.

