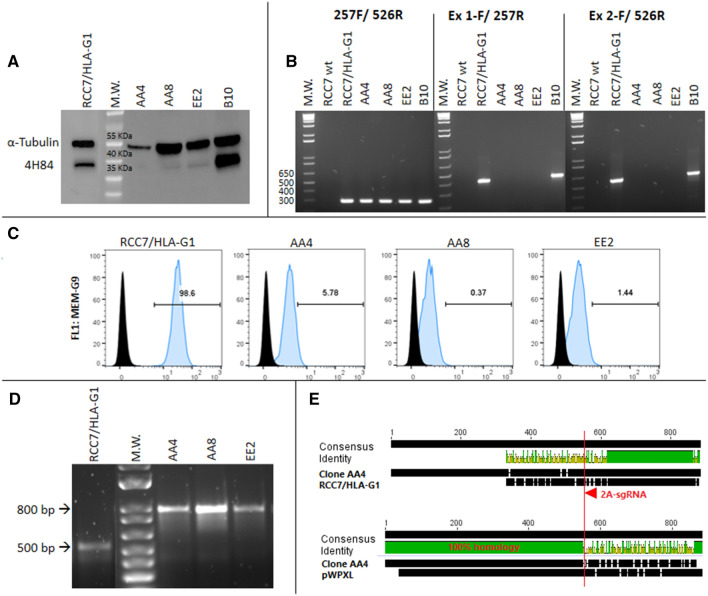
Figure 2.
Analysis of RCC7/HLA-G1 edited cells by CRISPR/Cas9: (A) Western Blot analysis of HLA-G expression in 2A-sgRNA clonal cell lines (right). Wild type RCC7/HLA-G1 control is shown on the left. (B) RT-PCR to analyze mRNA expression. (C) Flow cytometry analysis of HLA-G protein expression. (D) Genomic DNA amplified by PCR. (E) Sequence alignment of wild type RCC7/HLA-G1 vs. clone AA4 and pWXPL-lentivirus vector. The red arrow represents the 2A-sgRNA target site and the red line shows the cut site of Cas9 protein. http://www.geneious.com.

