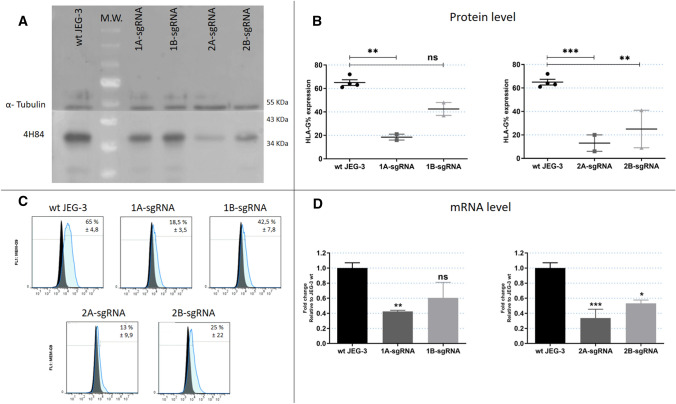
Figure 3.
Analysis of JEG-3 edited cells by CRISPR/Cas9 with each sgRNA (1A-, 1B-, 2A- and 2B) (A) Western Blot analysis of HLA-G expression in JEG-3 edited cells (right) and wild type JEG-3 (left). (B) Protein expression measured by flow cytometry. (C) Representative histograms of HLA-G measured by flow cytometry. Isotype control is shown in black. (D) The HLA-G mRNA expression measured by RT-qPCR. No significant: ns. Significant differences are shown with * (p < 0.05).

