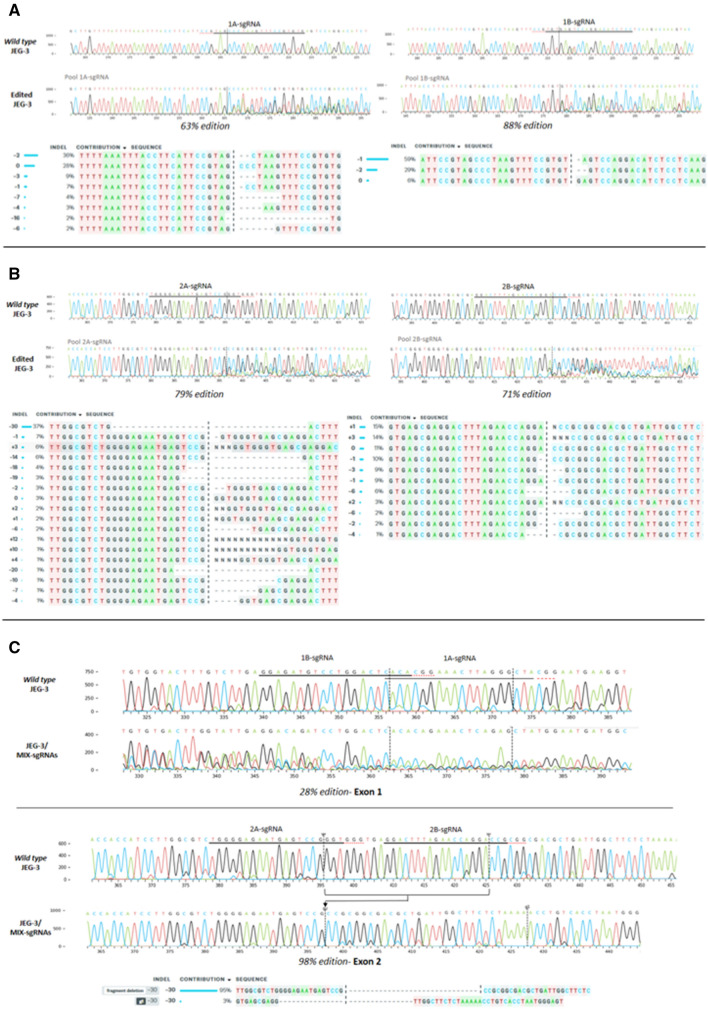
Figure 5.
Sequencing analysis. Histograms with nucleotide sequence data of cell pools edited by CRISPR system. Different edited genotypes predicted by InDels analysis (https://www.ice.synthego.com/) and percentage of edition for each condition: (A) JEG-3 cell pools edited with 1A- and 1B-sgRNAs, in exon 1 region. (B) JEG-3 cell pools edited with 2A- and 2B-sgRNAs, in exon 2 region. (C) JEG-3 cell pools edited with all sgRNAs (1A, 1B, 2A and 2B, named JEG-3/MIX-sgRNAs), in exon 1 and 2 simultaneously.

