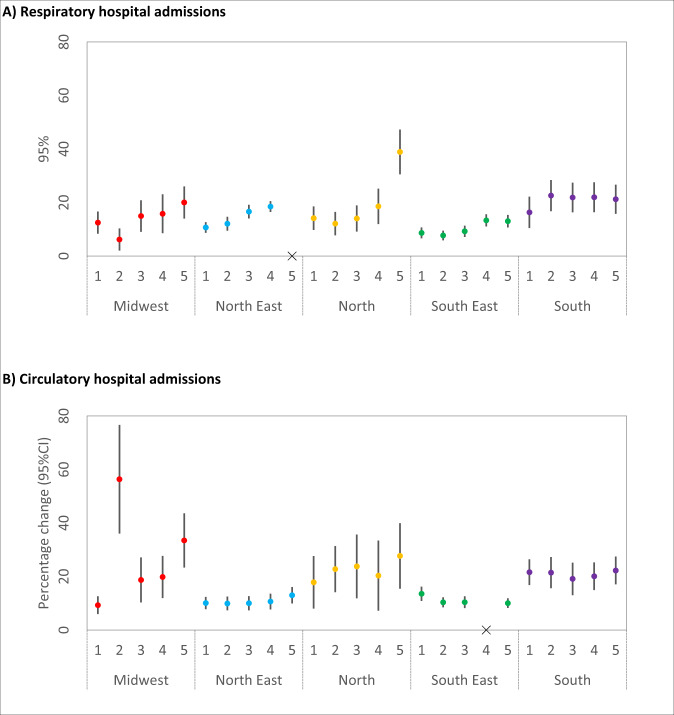
Fig. 2. Association between hospital admissions and wildfire-related PM2.5.
Regional percentage increase in risk (and 95% CI) of hospital admissions (A, respiratory diseases; B, circulatory diseases) associated with wildfire-related PM2.5 in wildfire waves for the moving averages 1–5 days. Note 1: Numbers in x-axis indicate the moving averages. Note 2: “x” means that there were very large groups of ties, which a large number of health events (defined as case day) is out of a large number of subjects (case plus control days). The algorithm in the Survival package may refuse to undertake the task (the computation is infeasible) due to overflow for the subscripts. Note 3: Red (Midwest), blue (North East), orange (North), green (South East), and purple (South). Note 4: n = 2,044,038 individuals.

