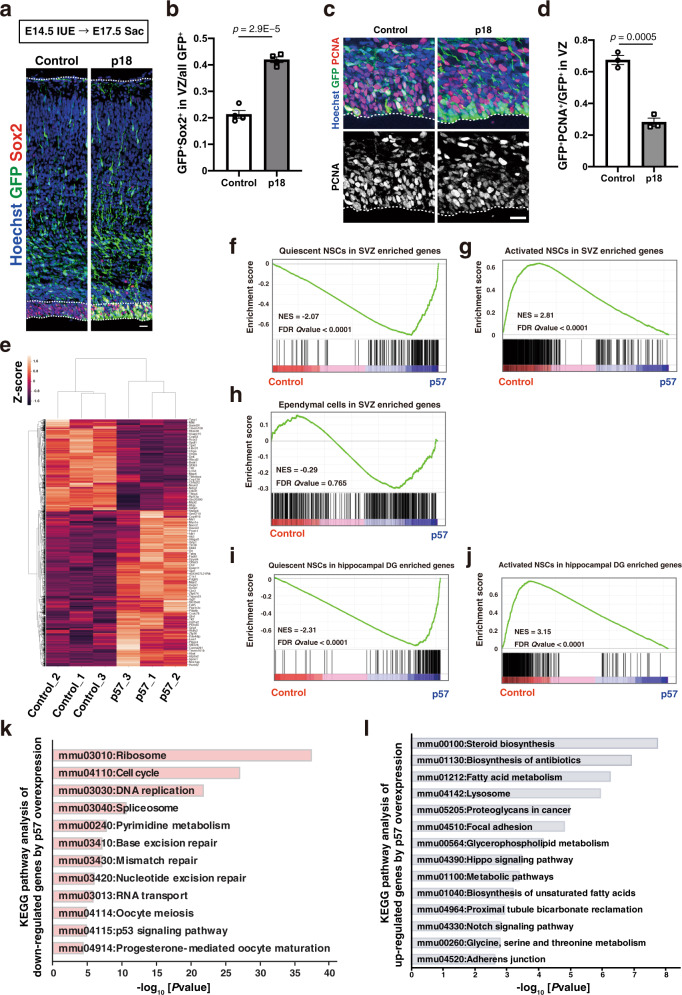
Fig. 1. p57 overexpression shifts the global transcriptional profile close to that of adult quiescent NSCs.
a, c Immunohistochemical analysis with antibodies to GFP and to either Sox2 (a) or PCNA (c) for brain sections prepared at E17.5 after in utero electroporation (IUE) with an expression plasmid encoding mouse p18 and GFP or with the corresponding plasmid encoding GFP alone (control) at E14.5. Nuclei were stained with Hoechst 33342. Scale bars, 20 μm. Dashed lines indicate the ventricular zone and the pial surface. b Quantification of the proportion of GFP+Sox2+ cells among all GFP+ cells. Five brain sections were analyzed per embryo. Data are means ± SEM (n = 4 embryos), two-tailed Student’s t test. d Quantification of the proportion of GFP+PCNA+ cells among all GFP+ cells in the VZ. Five brain sections were analyzed per embryo. Data are means ± SEM (n = 3 embryos), two-tailed Student’s t test. e Hierarchical clustering of the 3920 differentially expressed genes (DEGs, edgeR; p < 0.05). f–h GSEA of the adult quiescent NSCs (f), activated NSCs (g), and ependymal cells (h) in SVZ signature genes46 in control embryonic NPCs versus p57-expressing embryonic NPCs. NES normalized enrichment score; FDR false discovery rate. i, j GSEA of the adult quiescent NSCs (i) and activated NSCs (j) in hippocampal dentate gyrus signature genes47 in control embryonic NPCs versus p57-expressing embryonic NPCs. k KEGG pathway analysis of control NPCs enriched genes (edgeR; p < 0.03, expression top 800). l KEGG pathway analysis of p57-expressing NPCs enriched genes (edgeR; p < 0.03, expression top 1000).

