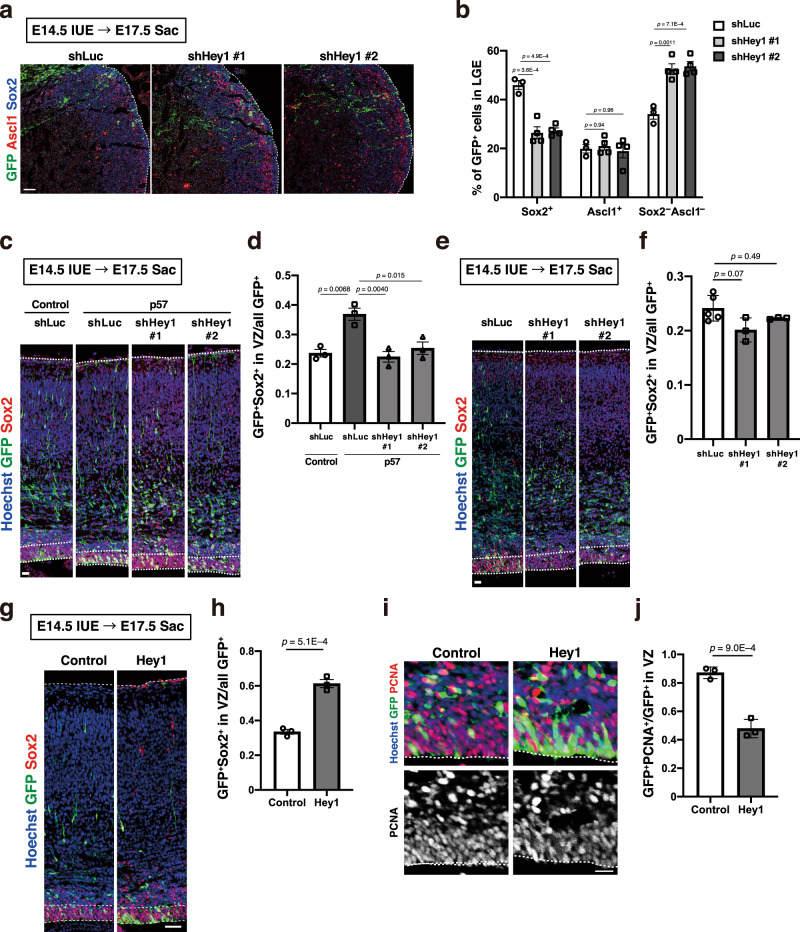
Fig. 4. Hey1 contributes to the maintenance of slowly dividing NPCs.
a Immunohistochemical analysis with antibodies to GFP, to Ascl1, and to Sox2 for the LGE at E17.5 after in utero electroporation at E14.5 with plasmids for GFP and either shLuc, shHey1 #1, or shHey1 #2. Scale bar, 100 μm. Dashed lines indicate the ventricular surface. b Quantification of the proportion of Sox2+, Ascl1+, or Sox2−Ascl1− cells among all GFP+ cells in the LGE for sections as in a. Five brain sections were analyzed per embryo. Data are means ± SEM (n = 3, 4, and 4 embryos for shLuc, shHey1 #1, and shHey1 #2, respectively), one-way ANOVA followed by Scheffe’s multiple comparison test. c, e Immunohistochemical analysis with antibodies to GFP and to Sox2 for neocortical sections prepared at E17.5 from embryos that had been subjected to in utero electroporation at E14.5 with plasmids for control (shLuc) or Hey1 (#1 or #2) shRNAs and either GFP plus p57 (c) or GFP alone (e). Nuclei were stained with Hoechst 33342. Scale bars, 20 μm. Dashed lines the ventricular zone and the pial surface. d, f Quantification of the proportion of GFP+Sox2+ cells among all GFP+ cells for sections as in c and e, respectively. Five brain sections were analyzed per embryo. Data are means ± SEM for n = 3 embryos (d) or for n = 5, 3, and 3 embryos for shLuc, shHey1 #1, and shHey1 #2, respectively, one-way ANOVA followed by Scheffe’s multiple comparison test. g, i Immunohistochemical analysis with antibodies to GFP and to either Sox2 (g) or PCNA (i) for brain sections prepared at E17.5 after in utero electroporation with an expression plasmid encoding mouse Hey1 and GFP or with the corresponding plasmid encoding GFP alone (control) at E14.5. Nuclei were stained with Hoechst 33342. Scale bars, 50 μm (g) or 20 μm (i). Dashed lines indicate the ventricular zone and the pial surface. h Quantification of the proportion of GFP+Sox2+ cells among all GFP+ cells. Five brain sections were analyzed per embryo. Data are means ± SEM (n = 3 embryos), two-tailed Student’s t test. j Quantification of the proportion of GFP+PCNA+ cells among all GFP+ cells in the VZ. Five brain sections were analyzed per embryo. Data are means ± SEM (n = 3 embryos), two-tailed Student’s t test.

