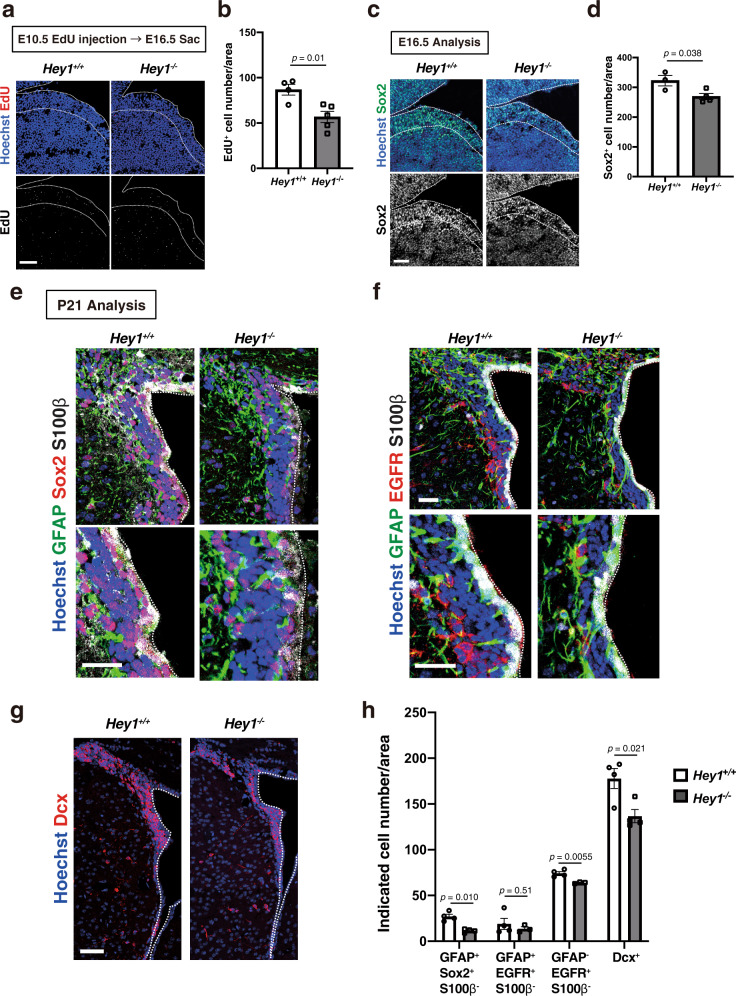
Fig. 5. Hey1 knockout reduces the number of slowly dividing NPCs and postnatal NSCs.
a EdU labeling for dLGE sections of Hey1 knockout and control embryos at E16.5 that had been exposed to EdU at E10.5. Nuclei were stained with Hoechst 33342. Scale bar 50 μm. Dashed lines indicate the border of the ventricular zone. b Quantification of the density of EdU+ cells in sections as in a. Five brain sections were analyzed per embryo. Data are means ± SEM (n = 4 or 5 for control and Hey1 knockout embryos, respectively), two-tailed Student’s t test. c Immunohistochemical analysis with antibodies to Sox2 for sections of the brain of control and Hey1 knockout mice at E16.5. Nuclei were stained with Hoechst 33342. Scale bars, 50 μm. Dashed lines indicate the border of the ventricular zone. d Quantification of the number of Sox2+ cells in sections as in c. Five brain sections were analyzed per embryo. Data are means ± SEM (n = 3 or 4 for control and Hey1 knockout embryos, respectively), two-tailed Student’s t test. e–g Immunohistochemical analysis with antibodies to GFAP, to Sox2, to S100β, to EGFR, and to Dcx (as indicated) for sections of the brain of control and Hey1 knockout mice at postnatal day (P) 21. Nuclei were stained with Hoechst 33342. Scale bars, 20 μm (e, f) or 50 μm (g). Dashed lines indicate the ventricular surface. h Quantification of the density of cells with the indicated marker phenotypes in the lateral wall of the SVZ for sections as in e through g. Five brain sections were analyzed per sample. Data are means ± SEM for n = 4 and 4 (e, g) or n = 4 and 3 (f) control and Hey1 knockout mice, respectively, two-tailed Student’s t test.

