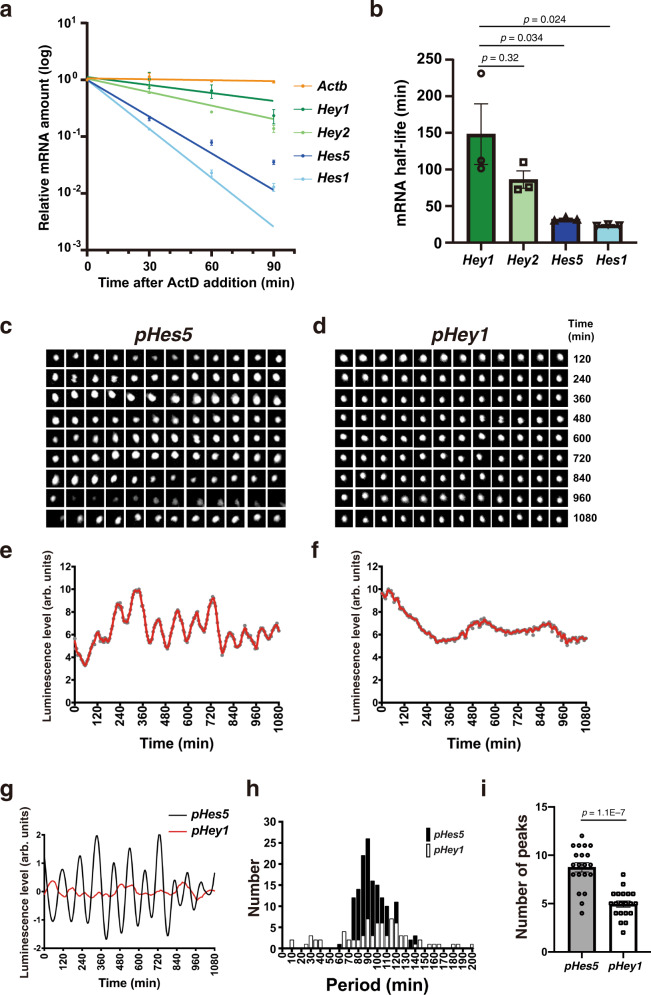
Fig. 6. The Hey1 promoter confers nonoscillatory expression dynamics.
a RT and real-time PCR analysis of Hes/Hey and Actb (β-actin) mRNA levels in cultured NPCs incubated in the presence of actinomycin D (5 µM) for the indicated times. The amount of each mRNA was expressed relative to that at time 0 (no actinomycin D treatment). Data are means ± SEM (n = 3 independent experiments). b Half-lives of Hes/Hey mRNAs determined from the data in a, one-way ANOVA followed by Scheffe’s multiple comparison test. c, d The pHes5-NLS-Ub-Luc2-Hes5-3′UTR or pHey1-NLS-Ub-Luc2-Hey1-3′UTR plasmids were introduced into cultured NPCs by electroporation together with expression vectors for NICD1 and mCherry. Representative bioluminescence images of individual mCherry+ cells are shown. e, f Quantification of bioluminescence for cells as in c and d, respectively. Data are expressed in arbitrary units (arb. units). g Detrended and smoothed data for e and f, respectively. h Distribution of oscillation period for Hes5 or Hey1 promoter activity determined from bioluminescence measurements (n = 20 cells for each sample). i Number of detected peaks for bioluminescence driven by the Hes5 or Hey1 promoters. Data are means ± SEM (n = 20 cells for each sample), two-tailed Student’s t test.

