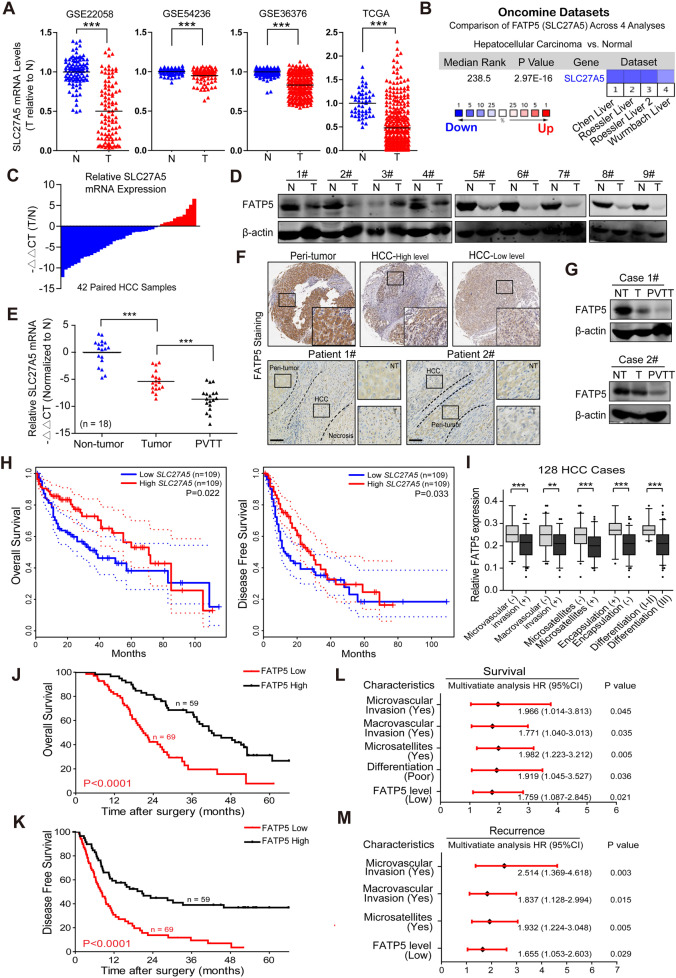
Fig. 1. Downregulated expression of FATP5 is frequently detected in HCC tissues and correlates with aggressive clinicopathological features and predicts poor oncologic prognosis in HCC patients.
A Relative mRNA levels of FATP5 (SLC27A5) in human HCC and normal liver tissues was analyzed using 4 HCC datasets (GSE22058, GSE54236, GSE36376, and TCGA Liver Hepatocellular Carcinoma dataset) and were shown by Box plots. Values represented as mean ± SD, ***P < 0.001, two-tailed t-test. B Other 4 independent studies published in ONCOMINE database were utilized to compare the mRNA expression of SLC27A5 in HCC specimens and non-tumor tissues. C Relative mRNA levels of SLC27A5 in 42 paired HCC and adjacent non-tumor tissues were evaluated by qRT-PCR and presented as −ΔΔCt values. D Western blotting was performed to detect FATP5 protein expression in HCC tissues (T) and their matched nontumoral tissues (N), and representative images were shown. β-actin was used as a loading control. E Relative mRNA expression of SLC27A5 in 18 pairs of peri-tumoral, tumor and portal vein tumor thrombus (PVTT) tissues were assessed by qRT-PCR. All data were normalized to nontumoral group and presented as −ΔΔCt values. ***P < 0.001, two-tailed t-test. For all assays in (C) and (E), the GAPDH expression was used as an endogenous control to normalize the mRNA levels. F Representative immunohistochemistry (IHC) staining of FATP5 in the TMA specimens (normal liver, high- and low-FATP5-expressing HCCs; upper panel) and matched peri-tumoral and tumor tissues from 2 independent HCC patients after surgery (down panel). Scale bar: 50 μm. G Representative western blotting showed the protein level of FATP5 in matched peri-tumoral, tumor and PVTT tissues. β-actin was used as a loading control. H Kaplan-Meier curves for overall survival (OS; left) and disease-free survival (DFS; right) rates of HCC patients in TCGA cohort. According to the mRNA levels of SLC27A5, HCC patients were divided into high- (top 30%) and low- (bottom 30%) SLC27A5-expressing groups, respectively. I Relative expression levels of FATP5 in 128 human HCC samples with or without micro-/macrovascular invasion, microsatellites, incomplete encapsulation and poor tumor differentiation. Values represented as mean ± SD, **P < 0.01, and ***P < 0.001, two-tailed t-test. J, K The OS and DFS rates in HCC patients with low- and high-FATP5 expression were analyzed by Kaplan-Meier’s method (P < 0.05 by log-rank test). L, M Multivariate analyses of the hazard ratios (HRs) for patient survival and tumor recurrence after curative resection. All enrolled variables were selected using univariate analyses and the HRs were presented as the means (95% confidence interval).

