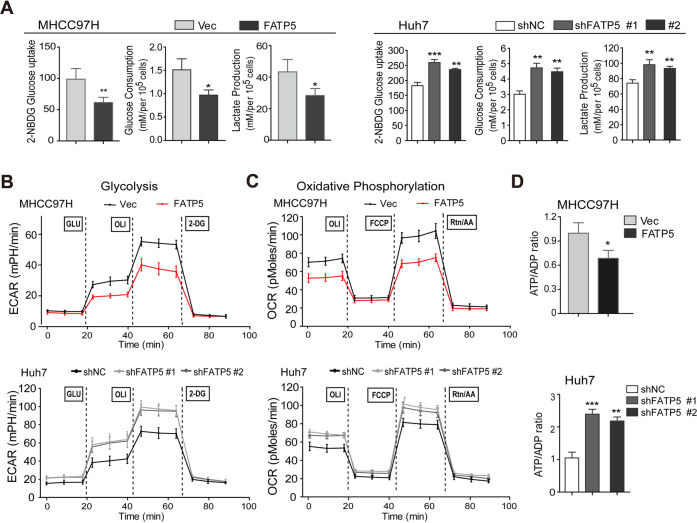
Fig. 4. FATP5 induces the activation of AMPK by reprogramming glycolysis and energy metabolism of HCC cells.
A HCC cells were incubated with 2-NBDG for 30 min and then washed and re-suspended with DMEM medium. The cellular fluorescence intensities were measured by flow cytometry. Glucose and lactate concentrations in normal culture medium and supernatants after cell incubation for 48 h were detected to calculate the glucose consumption and lactate production. B, C Both extracellular acidification rates (ECAR) and oxygen consumption rates (OCR) in different time points were measured using a Seahorse XF96 Extracellular Flux Analyzer either under basal conditions or after treatment with according inhibitors. Representative curves were shown and each data was presented as mean ± SD, with the average value of 6 independent wells. D The cellular ATP content in HCC cells was measured and the ATP/ADP ratio was expressed as the fold change relative to their corresponding Vec- or shNC-expressing cells (presented as equal to 1). All results in (A) and (D) were normalized to cell numbers and protein contents, respectively, *P < 0.05, **P < 0.01 and ***P < 0.001 vs. negative controls. Abbreviations: OLI, oligomycin; FCCP, carbonyl cyanide p-trifluoromethoxy-phenylhydrazone; Rtn/AA, rotenone/antimycin; 2-DG, 2-deoxyglucose.

