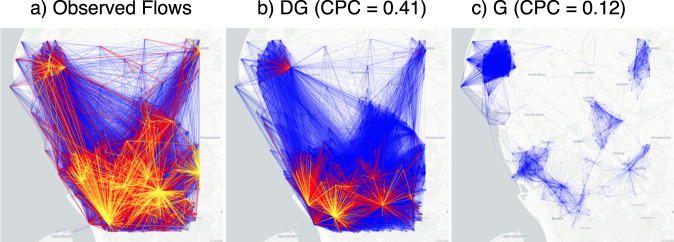
Fig. 2. Real flows versus generated flows.
Visualization of the mobility network describing the observed flows (a), the flows generated by Deep Gravity (DG, panel b), and those generated by the gravity model (G, panel c) on a region of interest with 1001 locations (OAs) in the north of Liverpool, England, UK. Colored edges denote observed (a) or average flows (b, c): blue edges indicate flows with a number of commuters between 0 and 3, red edges between 3 and 5, and yellow edges above 5 commuters. CPC indicates the Common Part of Commuters. While both DG and G underestimate the flows, DG captures the overall structure of the flow network more accurately than G.

