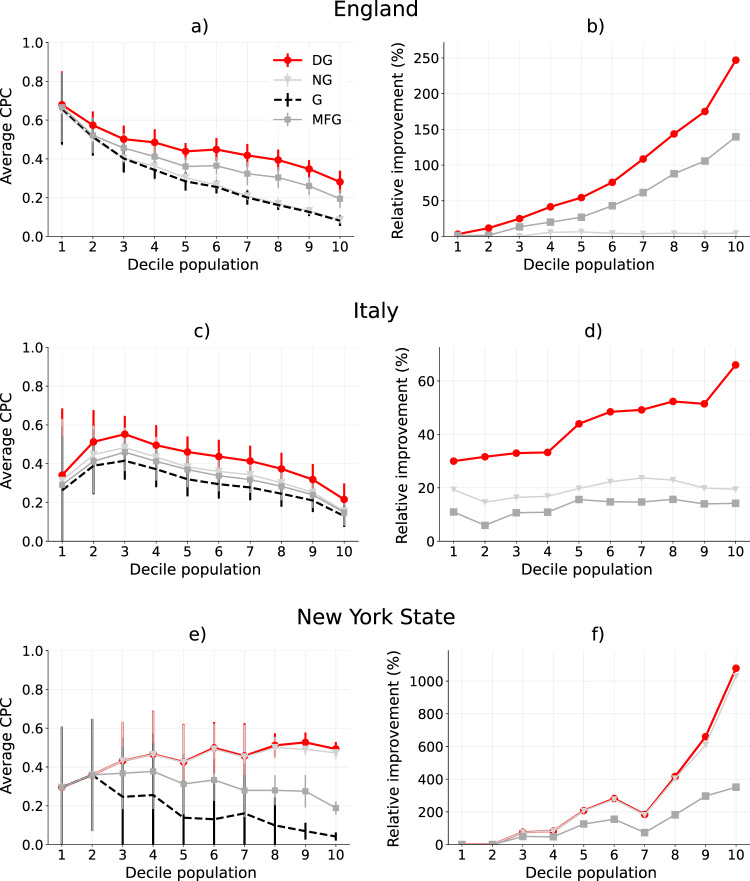
Fig. 4. Performance of the models.
a, c, e Comparison of the performance in terms of Common Part of Commuters (CPC) of the gravity model (G, dashed line), Nonlinear Gravity (NG), Multi-Feature Gravity (MFG), and Deep Gravity (DG), varying the decile of the population and for regions of interest sizes of 25km for England (a), Italy (c) and New York State (e). Circles (DG), triangles (NG), and squares (MFG) indicate the average CPC for a decile. Error bars indicate the standard deviation of CPC of each decile. We run five independent experiments in which we train the models on 50% of randomly chosen tiles, stratifying according to the population in the decile, corresponding to 84,491.63 Output Areas for England, 200,746.15 Census Areas for Italy and 2118.93 Census Tracts for New York State. The remaining 50% of the tiles are used to evaluate the performance of the models in terms of CPC. DG is by far the approach with the best average CPC, regardless of the decile of the population. b, d, f Relative improvement with respect to G of NG, MFG, and DG, varying the decile of the population and for regions of interest of 25 by 25 km2. The higher the population the higher is the improvement of DG with respect to G. For example, in England, for the last decile of the population, DG has an improvement of around 246% over G. Similarly, in Italy DG has a relative improvement of around 66%, while in New York State DG is around 1076% better than G in the last decile.

