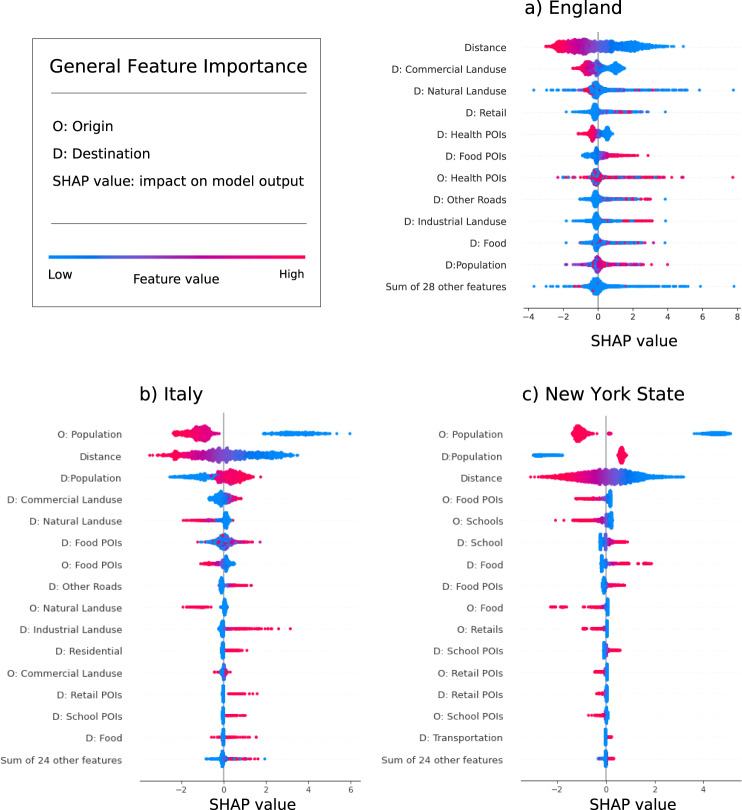
Fig. 5. Explaining Deep Gravity.
Distribution of Shapely values for all features in Deep Gravity for England (a), Italy (b), and New York State (c). Features are reported on the vertical axis and are sorted from the most relevant on top to the least relevant on the bottom. Feature names starting with “D:” and “O:” indicate features of the destination and origin, respectively. Each point denotes an origin-destination pair, where blue points represent pairs where the feature has a low value and red points pairs with high values. For each variable, these points are randomly jittered along the vertical axis to make overlapping ones visible. The point’s position on the horizontal axis represents the feature’s Shapely value for that origin-destination pair, that is, whether the feature contributes to increase or decrease the flow probability for that pair. For example, high distances tend to be a travel deterrence while short distances are associated with an increment of commuters.

