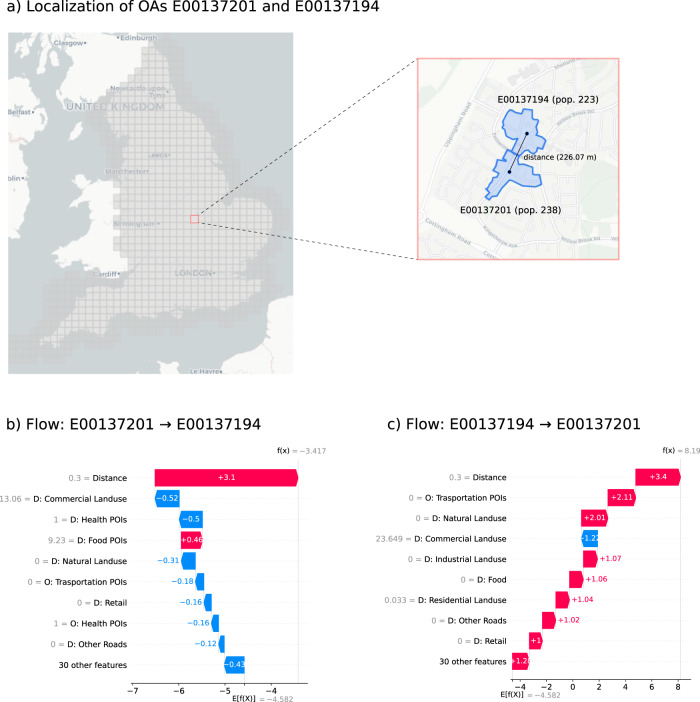
Fig. 6. Explaining generated flows.
a Geographic position, shape, population, and distance between the Output Areas (OAs) E00137201 and E00137194, situated in Corby, England, a city with more than 50 thousand inhabitants (8th population decile). b, c Shapely values for the two flows between E00137201 (population of about 238 individuals) and E00137194 (population of about 223 individuals). Features are reported on the vertical axis, sorted from the most relevant on top to the least relevant on the bottom. The value of the feature is indicated in gray on the left of the feature name. The bars denote the contribution of each feature to the model’s prediction (the number inside or near the bar is the Shapely value). The sum of the Shapely values of all features is equal to the model’s prediction (f(x) denotes the score): feature with positive (negative) Shapely values push the flow probability to higher (lower) values with respect to the model’s average prediction E[f(x)]. Deep Gravity assigns different probabilities for the two flows and the Shapely values indicate that various geographical features are more relevant than the population in this case. The most relevant features for a specific origin-destination pair can differ from the most relevant features overall.

