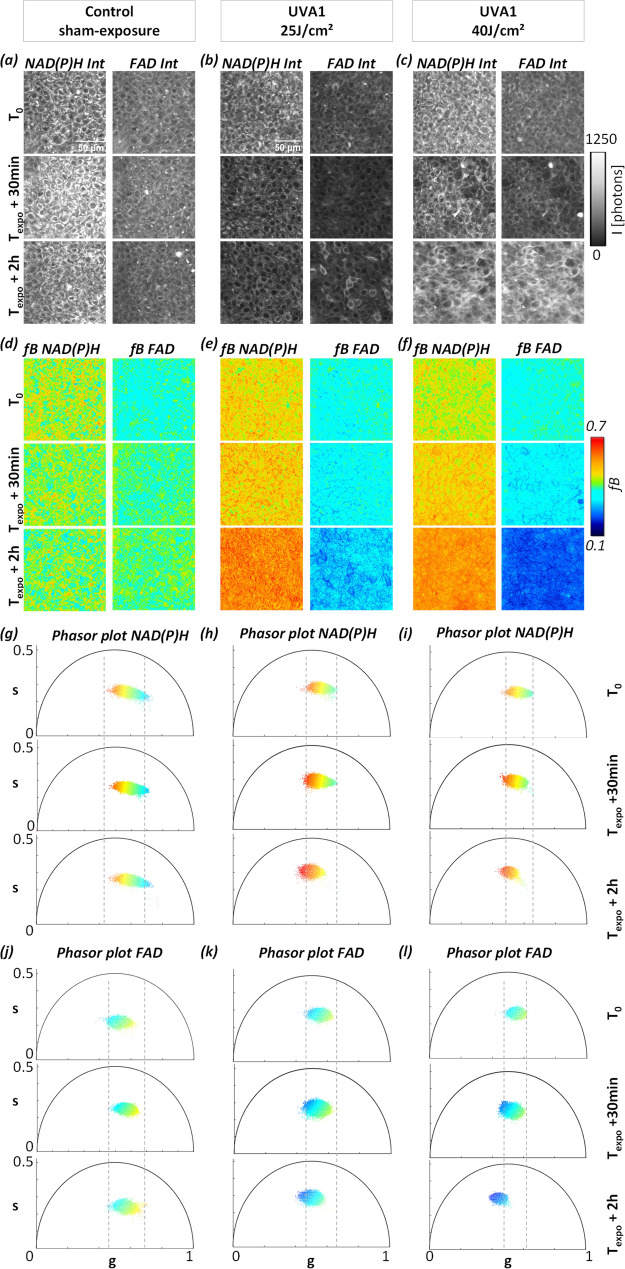
Figure 3.
Temporal dynamic of UVA1 dose effects on NAD(P)H and FAD metabolic biomarkers in basal keratinocytes of reconstructed human skin. Representative images of (a–c) NAD(P)H and FAD fluorescence intensities and (d–f) fB fractions of bound NAD(P)H and FAD acquired before (T0), at 30 min (Texpo + 30 min) and 2 h (Texpo + 2 h) post sham-exposure (Control) or UVA1 exposure at 25 J/cm2 and 40 J/cm2. (g–i) Representative phasor plot scatters of NAD(P)H and (j–l) FAD fluorescence lifetime data of the same samples at T0, Texpo + 30 min and Texpo + 2 h. Every pixel of the phasor plot is color coded according to the fraction of bound metabolites with the same look up table as for images (d)–(f).

