Figure 6.
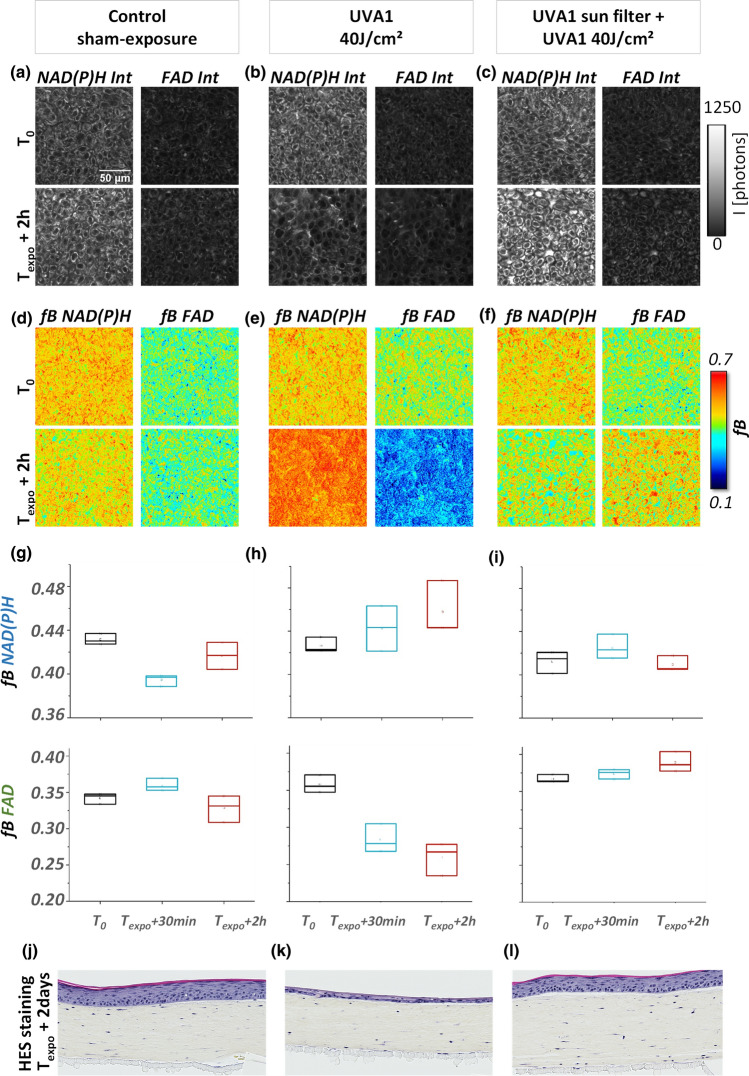
Effect of a long UVA filter on NAD(P)H and FAD metabolic stress response to UVA1. (a–c) Example of NAD(P)H and FAD fluorescence intensities and (d–f) fractions of bound NAD(P)H and FAD before (T0) and 2 h (Texpo + 2 h) post sham-exposure (Control), UVA1 40 J/cm2 exposure in the presence and absence of a long UVA sun filter. (g–i) Quantification of fractions of bound NAD(P)H and FAD of the same samples at three experimental time points (T0, Texpo + 30 min and Texpo + 2 h). Data are presented as boxplots. (j–l) Histological HES (hematoxylin eosin saffron) analysis of the same reconstructed human skin samples imaged by FLIM, replaced in culture and fixed at 2 days post exposure.

