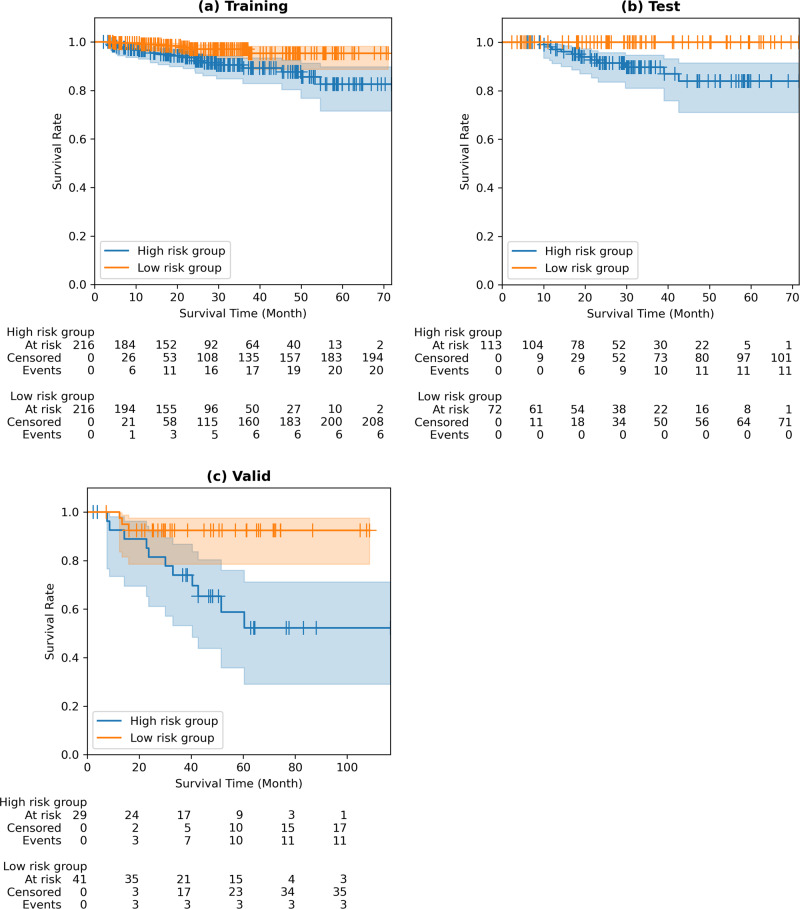
Fig. 3. Kaplan–Meier plots of radiomics-guided DL (Yolo) model.
a Kaplan–Meier plot of training cohort, hazard ratio of 3.1728 (95% CI of 1.4675–6.8596), p-value of 0.0061, and C-index of 0.7994. b Kaplan–Meier plot of test cohort, hazard ratio of 7.6277 (95% CI of 2.2870–25.4399), p-value of 0.0027, and C-index of 0.7593. c Kaplan–Meier plot of validation cohort, hazard ratio of 6.5362 (95% CI of 2.1773–19.6213), p-value of 0.0022, and C-index of 0.7696.

