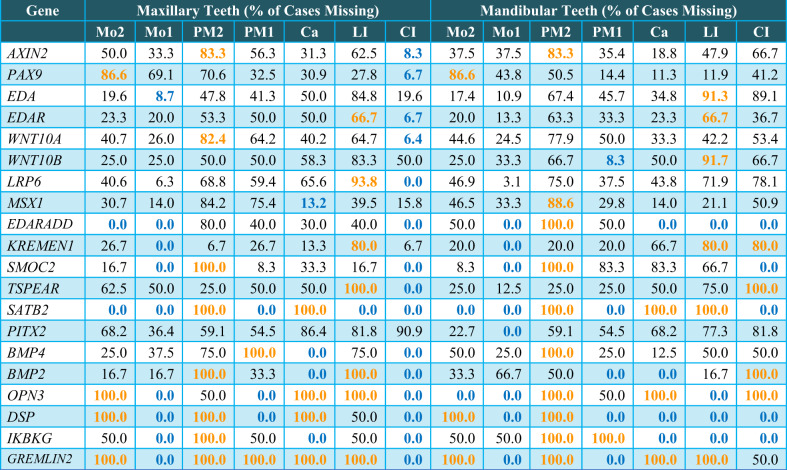
Table 2.
Frequencies of tooth absence (in percentage) among the study cases affected by PAX9, MSX1, WNT10A, WNT10B, AXIN2, EDA, EDAR, EDARADD, LRP6, KREMEN1, SMOC2, and PITX2 gene mutations
Please note that the same type of tooth absent in the right and left arches were pooled together for the calculation. Numbers in gold color represent the highest frequency and numbers in blue color represent the lowest frequency of tooth type absence in each causative gene Ca canine; CI central incisor; LI lateral incisor; Mo molar; PM premolar.

