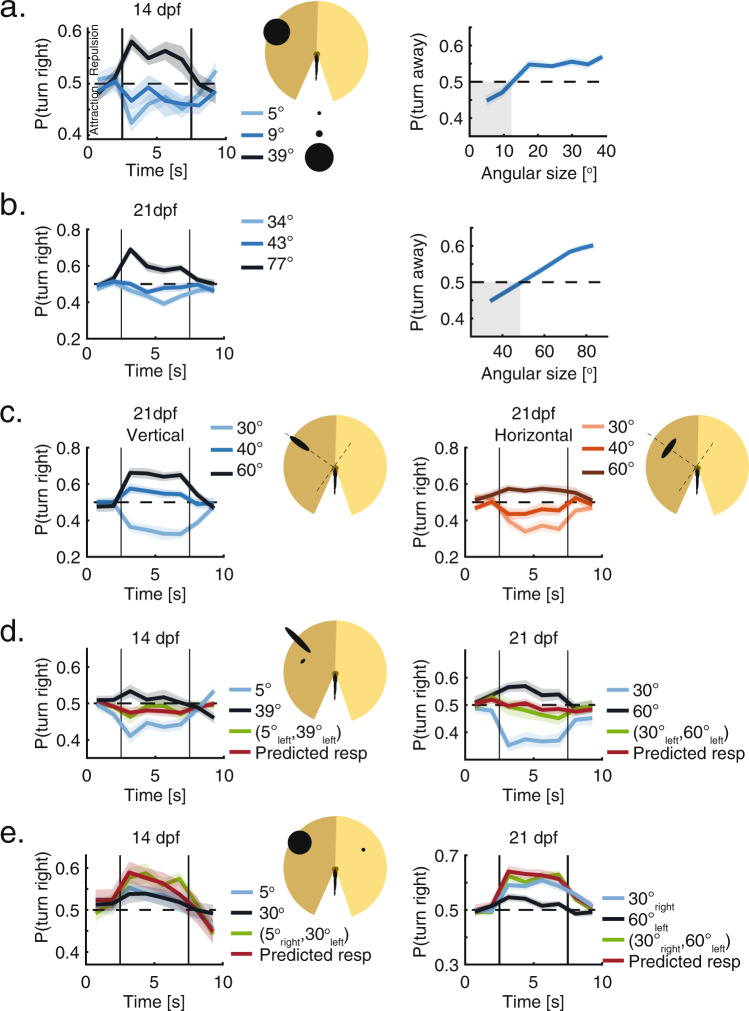
Fig. 3. Older larvae use similar algorithms to integrate visual social information.
a Left: Probability to turn right per bout in response to dots of different sizes presented to the left visual field. At 14 dpf, fish show both attraction to small angular sizes and repulsion from larger sizes (N = 32 fish). Right: Probability to turn away from dots of different sizes, presented to the left of the fish, calculated over the entire stimulus duration. Gray shaded area marks retinal occupancy values for which fish exhibit attraction. b Same as in A, only for 21 dpf larvae (“Methods”). c Left: Probability of 21 dpf larvae to turn right per bout, in response to ellipses of increasing vertical size (perpendicular to the plane of the eye), while horizontal sizes remain constant at 23o (N = 32 fish). Right: Same but in response to ellipses of increasing horizontal sizes (parallel to the plane of the eye), while vertical sizes remain constant at 23o (N = 32 fish). d Left: Probability to turn right per bout in response to two images presented together to the left visual field of 14 dpf larvae (green line); to each of the images presented alone (blue lines) and the prediction based on the weighted average of the responses to each stimulus presented alone (red line, “Methods”), where the weights of the responses are equal (N = 32 fish). Right: Same but for 21 dpf larvae. e Left: Probability to turn right per bout in response to two dots presented simultaneously to both eyes of 14 dpf larvae (green line); for each dot presented alone (blue lines) and the prediction based on the linear summation of the recorded response biases to each dot presented alone (red line, “Methods”)(N = 32 fish). Right: same but for 21 dpf larvae. In all panels probability to turn right per bout is calculated as the fraction of right turns out of all turns in 1.25 s time bins (“Methods”). Bold lines are average; shaded areas are SEM.

